


Thematic Map Visualization (themevisualization)
Introduction
Demonstrate the production of point density diagrams, grade symbol diagrams, thermal diagrams, and grid diagrams.
Operation effect
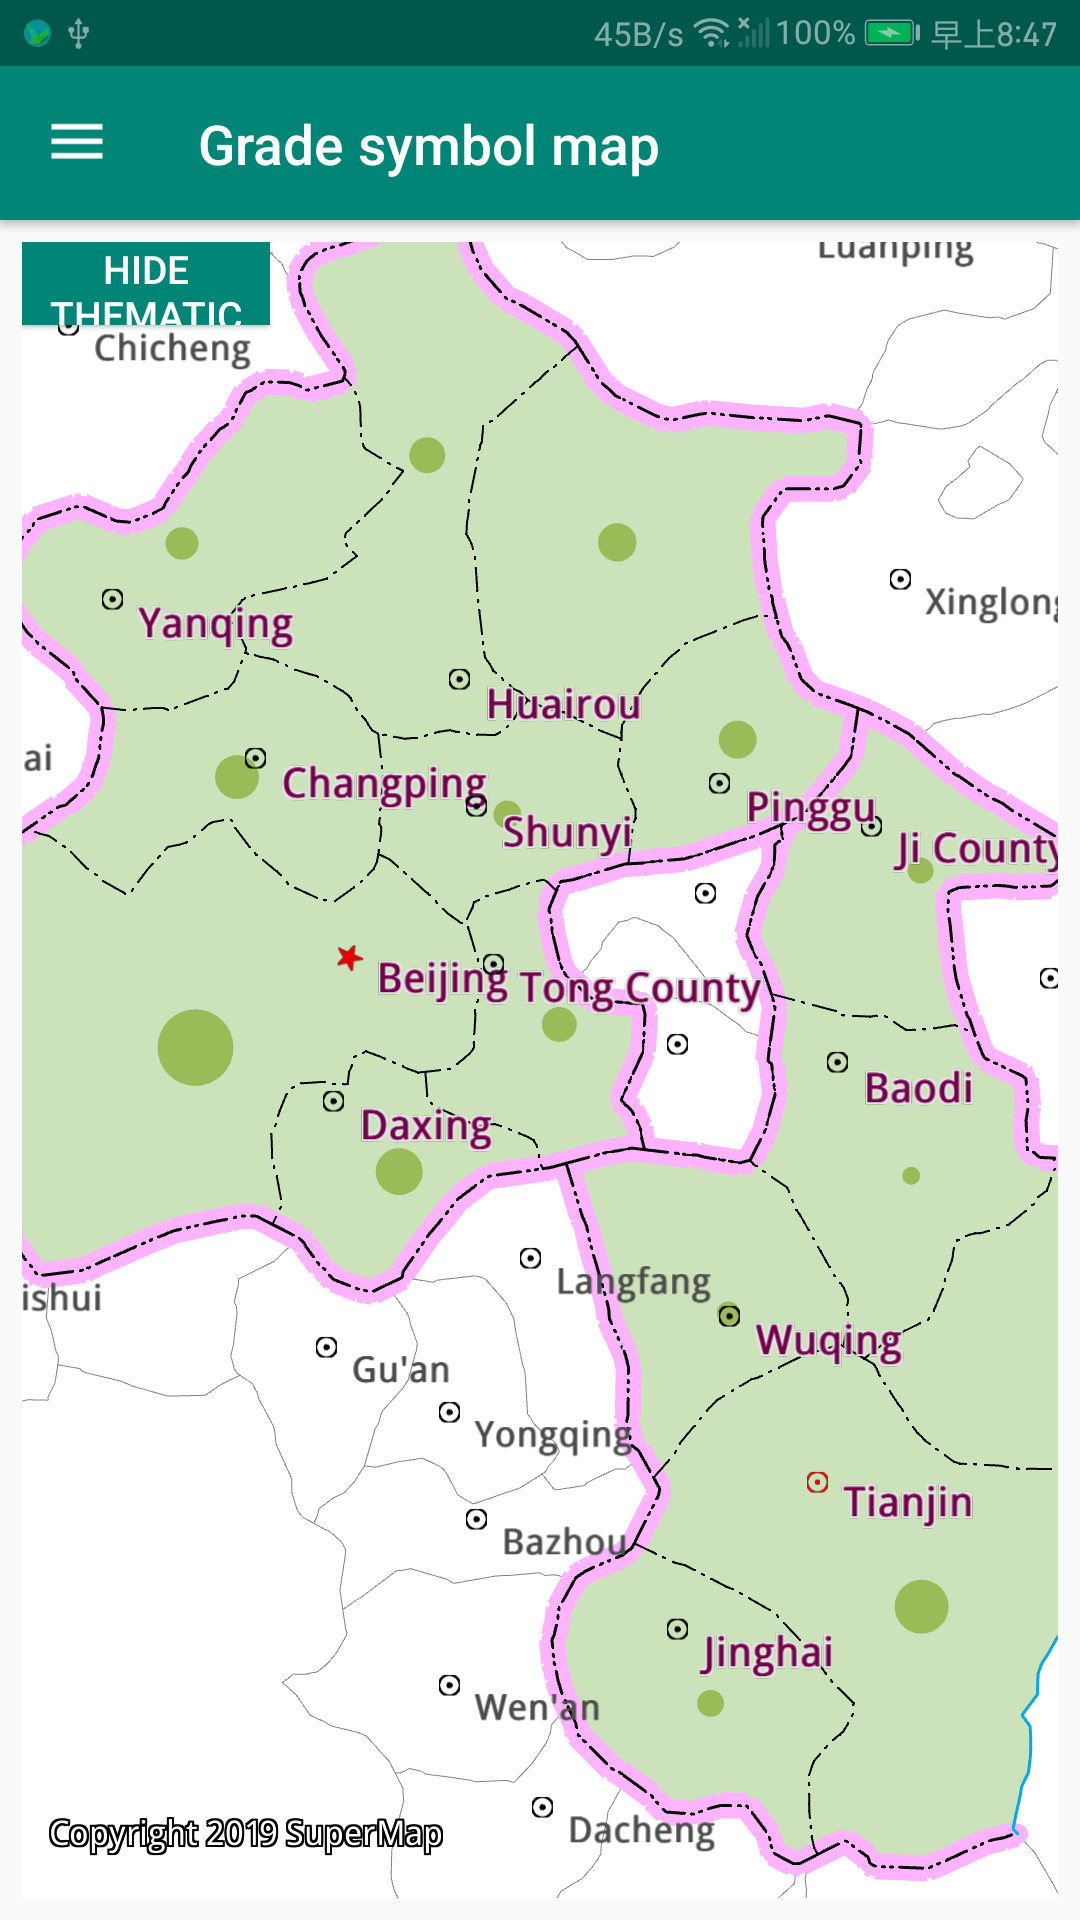 |
| Figure: Thematic Map Visualization Operation Effect |
Location
Android Studio
- Product package: Product package\SampleCode\SampleCode_AndroidStudio\AndroidStudioSampleCode\themevisualization
Data
Storage location
- Product package: Product package\SampleData\ThematicMaps
Deployment Location: mobile device internal storage\SampleData\ThematicMaps
License
Offline license, copy the license file to the "mobile device internal storage\SuperMap\License" folder.
Library
| jar |
|---|
| com.supermap.data.jar, com.supermap.mapping.jar |
| so |
| libimb2d.so, libgnustl_shared.so, libQt5Core.so, libQt5Gui.so, libQt5Svg.so, libQt5Widgets.so(Note: Starting from version 11.1, the last five so libraries need to be added.) |
Key types/members
| Control/Class | Method |
|---|---|
| ThemeDotDensity | setDotExpression(), setValue(), setStyle() |
| ThemeGraduatedSymbol | setExpression(), setBaseValue(), setGraduatedMode(), setPositiveStyle() |
| Layers | addHeatmap(), addGridAggregation() |
| LayerHeatmap | setFuzzyDegree() |
| LayerGridAggregation | setColorset(), setGridWidth(), setGridAggregationType() |
| Enum | Value |
| LayerGridAggregationType | HEXAGON |
Basic steps
- Swipe right to select a graduated symbol map
- Swipe right to select a heat map
- Swipe right to select a grid map