Tutorial
iManager Environment Monitoring
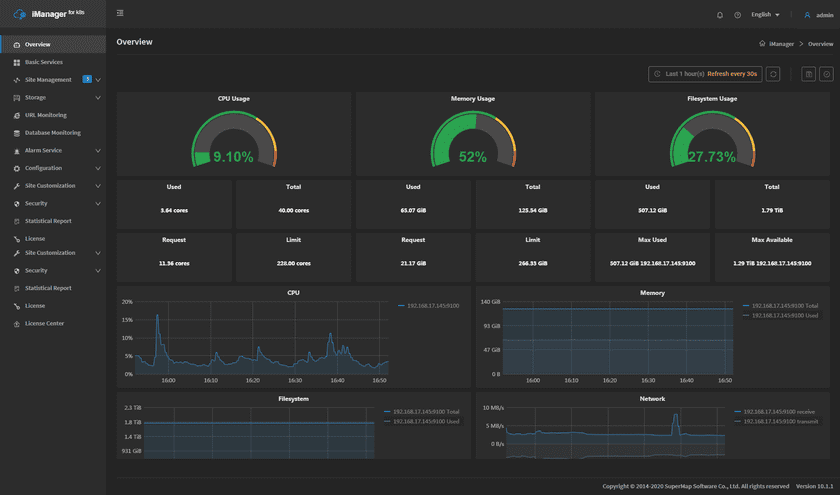
SuperMap iManager provides the real-time monitoring of physical machines environment, includes the machines to install Kubernetes master and worker nodes. iManager is running on Kubernetes, so a stable Kubernetes environment is the basic guarantee of the system. The overview page provides the monitoring indicators of CPU, Memory, Filesystem, and Network for Kubernetes node machines. Users can understand the health of iManager hardware environment, and find out the problem machine. The details of the monitoring content is introduced below:
Clicks Overview on the left navigation bar to enter the page. The page shows the loading of the machines by number and statistic charts(The number of machines is according to the actual requirement):
- The circle statistic charts show the useage of CPU, Memory, and Filesystem of iManager environemnt.
- The value under the circle statistic charts show the used/total amounts of the system resources.
- The CPU chart records the CPU useage of each machine.
- The Memory and Filesystem chart records the used/total amounts of the system resources of each machine.
- The Network chart records the receive/transmit speed between the machines.
Notes:
When viewing monitoring statistic charts, please make sure the time settings of local machine and Kubernetes node machines are same.
Clicks on the IP in the chart legend can switch the machine to view. The panels support to be dragged and adjusted.
More functions on the overview page are listed below:
- Select recording range: Choose the time range of the monitor recording.
- Set refresh time: Set the refresh interval of the panels.
- Refresh: Click the button to refresh the panels.
- Save dashboard: After changing the panels’ size or draging the panels, click the button to save the current layout.
- Versions: All the layout styles are saved in the Versions, the Versions has the ability of restoring the layout to any style.
