Tutorial
Database Monitoring Management
Database Monitoring List
The added database is listing on the URL Monitoring page of iManager. Using the functions below to manage the URLs:
- Name: The name of database monitoring, set when adding the database monitoring.
- Address: The address of database monitoring.
- Type: Databae type.
- Status: The status of database monitoring, display whether to running good, whether to silence alert, and etc.
- Owner: The user who added the database Monitoring.
-
Operations:
- Alert history: View the history of database alert.
- Silence: Pause the alert of database monitoring. Click to fill in the time for silence.
- Remove silence: Delete the silence setting.
- Metric Collector: Click to enter the Exporter monitoring page.
- Delete: Delete the URL monitoring.
Database Monitoring Details
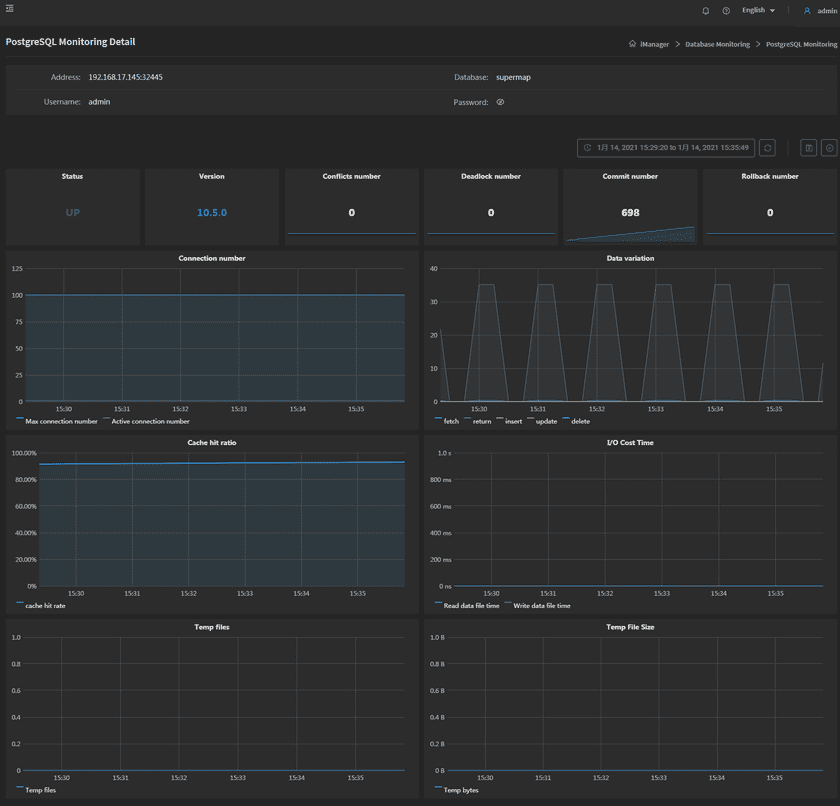
On the page of URL Monitoring, click on the name of the URL monitoring to enter the details page, you can see the following information:
- Address: The address of database monitoring.
- Database: The name of monitoring dabatabse.
- Username: The account username of monitoring database.
- Password: The account password of monitoring database.
There are multiple indicators of database monitoring on the bottom of the details page, you can check the database by these indicators:
- Status: Whether the database connect to the server.
- Version: The version of database.
- Number of Conflicts: Number of queries canceled due to conflicts with recovery in this database.
- Number of Deadlocks: Number of deadlocks detected in this database.
- Number of Commits: Number of transactions in this database that have been committed.
- Number of Roll Backs: Number of transactions in this database that have been rolled back.
- Number of Connections: Sets the maximum number of concurrent connections.
- Data Change: Number of rows deleted(fetched, inserted, returned, updated) by quries in this database.
- Blocks Hit: Number of times disk blocks were found already in the buffer cache, so that a read was not necessary.
- Blocks Read & Write Time: Time spent reading/writting data file blocks by backends in this database, in milliseconds.
- Temporary Files: Number of temporary files created by queries in this database.
- Temporary Bytes: Total amount of data written to temporary files by queries in this database.
Notes:
The indicators introduction above are for PostgreSQL, Oracle, and MongoDB. Please move your mouse to the exclamation mark on the top left side of each MySQL index panel to see the indicators introduction of MySQL.
The monitoring panels could be enlarged or narrowed, and draged to other places of the page. More functions are listed below:
- Select recording range: Select the time range of the monitor recording.
- Set refresh time: Set the refresh interval of the panels.
- Refresh: Click the button to refresh the panels.
- Save dashboard: After changing the panels’ size or draging the panels, click the button to save the current layout.
- Versions: All the layout styles are saved in the Versions, the Versions has the ability of restoring the layout to any style.
Exporter Monitoring and Management
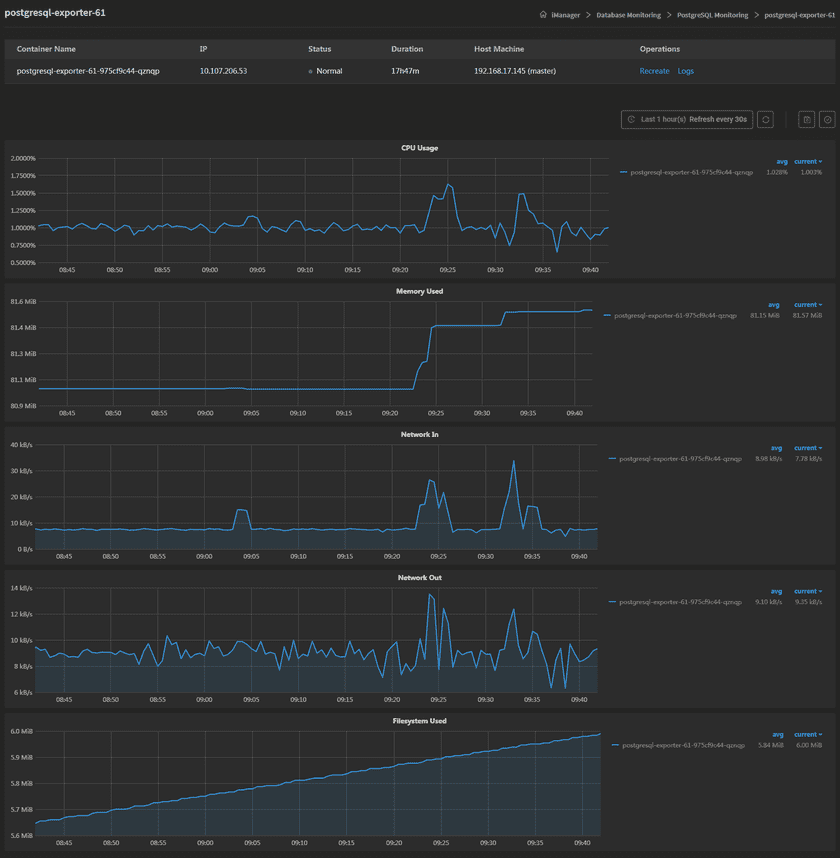
The system will create the exporter when adding database monitoring, the exporter is used for index collection. Clicks on Metric Collector to enter the exporter details page, the page lists the information of container name, IP, status, duration, and host machine. If the exporter malfunctioned, you can recreate the exporter, the service would stop working until finishing recreating. Clicks on Logs to see the exporter’s log, the log has the running record of the exporter from creation to the present.
On the bottom of the page, the monitoring panels record the real-time indicators of CPU useage, memory useage, network in/out, and filesystem useage of the exporter.


