Tutorial
Basic Services Monitoring
SuperMap iManager supports to monitor basic services. Administrator can understand the status of iManager by monitoring the services and containers.
Environment Monitoring
For monitoring basic services environment, click Basic Services on the left navigation bar on the iManager webpage, and roll to the monitoring panels on the bottom of the page.
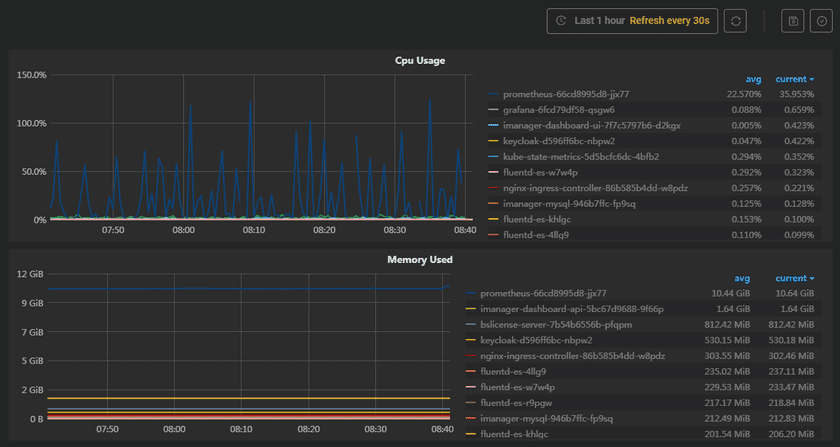
The screenshot below is the statistic chart of basic services. The monitoring panels record the real-time indicators of CPU useage, memory useage, network in/out, and filesystem useage of the services. The monitoring panels could be enlarged or narrowed, and draged to other places of the page. More functions are listed below:
- Select recording range: Choose the time range of the monitor recording.
- Set refresh time: Set the refresh interval of the panels.
- Refresh: Click the button to refresh the panels.
- Save dashboard: After changing the panels’ size or draging the panels, click the button to save the current layout.
- Versions: All the layout styles are saved in the Versions, the Versions has the ability of restoring the layout to any style.
Container Monitoring
On the Basic Services page, click on the service name to enter the container details page, you can see the container’s statistic chart.
The monitoring panels record the real-time indicators of CPU useage, memory useage, network in/out, and filesystem useage for the container. The monitoring panels could be enlarged or narrowed, and draged to other places of the page. What is more, users can save dashboard, control versions, select recording range, set refresh time, and manual refresh the panels, please refer to Environment Monitoring for the details.
