GIS Cloud Suite
Kafka Cluster
Apache Kafka is a distributed streaming platform, can be used as the receiver in stream processing model. GIS Cloud Suite has built-in Kafka Cluster, users can open and use directly. More detailed introduction of Kafka please refer to Kafka Official Documentation, the configuration of Kafka Receiver please refer to SuperMap iServer Documentation.
Kafka Cluster Management
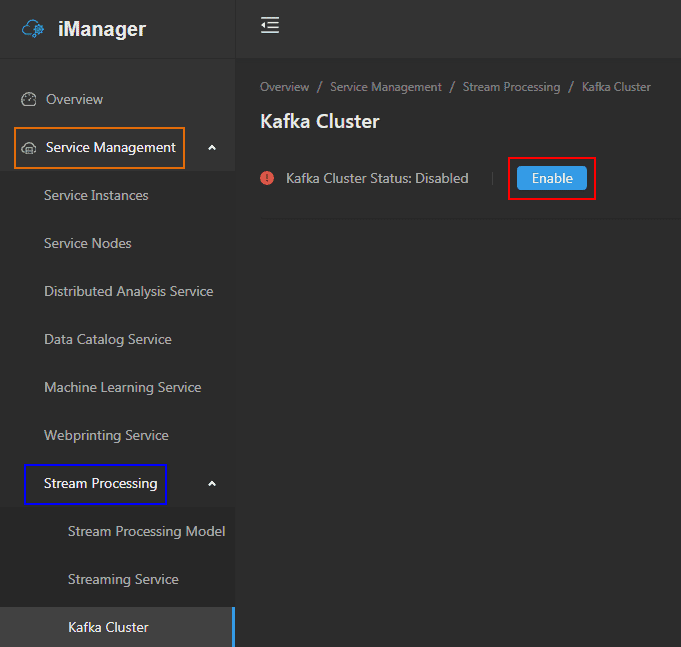
GIS Cloud Suite supports to manage built-in Kafka Cluster, users can open built-in Kafka Cluster by clicking on Service Management > Stream Processing > Kafka Cluster > Enable.
Service Management
On the Kafka Cluster page, use the functions below to manage the services:
- Name: The name of the service, clicks on the name to enter the container page.
- Address: Provides the service address, clicks the link to enter service client.
- Description: The function of the services.
- Status: Shows the number of running/total nodes in the service.
- Adjust Spec: Adjusts the service’s CPU and Memory spec.
- Redeploy: Redeploys the service.
- Expose Address: Exposes the service access address.
Container Management
Clicks on the name of service to enter the container page, the page lists the information of container name, IP, status, duration, and host machine. If any container malfunctioned, you can recreate the container, the service would stop working until finishing recreating.
Clicks on Logs to see the container’s log, the log has the running record of the container from creation to the present. Clicks Command Pad to enter the container’s command interface.
Notes:
Using [shift + insert] to paste the commands into the Command Pad.
Kafka Cluster Monitoring
Environment Monitoring
Clicks on Stream Processing > Kafka Cluster on the left navigation bar, roll to the monitoring panels on the bottom of the page.
The monitoring panels record the real-time indicators of CPU useage, memory useage, network in/out, and filesystem useage of the services. The monitoring panels could be enlarged or narrowed, and draged to other places of the page. More functions are listed below:
- Select recording range: Choose the time range of the monitor recording.
- Set refresh time: Set the refresh interval of the panels.
- Refresh: Click the button to refresh the panels.
- Save: After changing the panels’ size or draging the panels, click the button to save the current layout.
- Versions: All the layout styles are saved in the Versions, the Versions has the ability of restoring the layout to any style.
Container Monitoring
Clicks on the service name to enter the container details page, and view the container’s statistic chart.
The monitoring panels record the real-time indicators of CPU useage, memory useage, network in/out, and filesystem useage for the container. The monitoring panels could be enlarged or narrowed, and draged to other places of the page. What is more, users can save dashboard, control versions, select recording range, set refresh time, and manual refresh the panels, please refer to Environment Monitoring for the details.

