Tutorial
Monitor GIS Portals
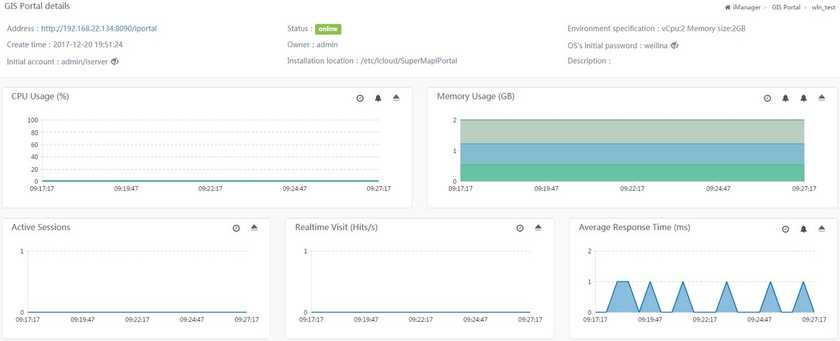
Clicks on the GIS server name or “Details” button to view detailed monitoring information of the GIS portal, including service address, status, CPU useage, memory useage, active Session number, real-time access statistics, average response time.
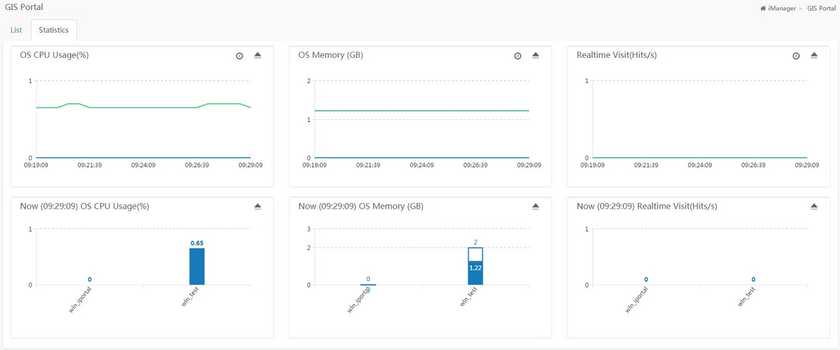
You can monitor the system CPU occupation (%) of all GIS portals, system memory (GB), real-time access statistics (times/sec), system current memory (GB), and current access statistics (times/sec) on the GIS Portal Statistics page (iManager).

