Tutorial
Check GIS Servers
The super administrator can see GIS servers of all users. Department administrators can see GIS servers of of their own departments and subordinate departments. Ordinary users can only see their own GIS servers.
On the GIS Server List page, you can view all GIS servers and the basic configuration information of each GIS server you have permission to see, such as the name of the GIS server, address, status, and types of operations supported (including remove, details, restart, and stop).
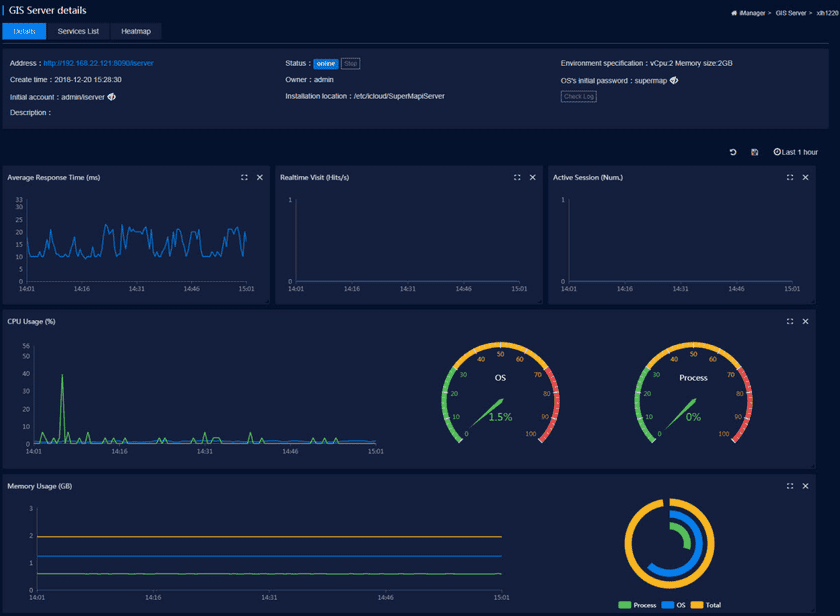
Clicks on the GIS server name or the corresponding “Details” button to view detailed information of the GIS server, including service address, status, map access hotspot statistics, CPU useage, memory useage condition, active Session number, real-time access statistics, average response time and so on. Docker platform, in the details, you can also see ftp address、ftp username、 ftp password、ftp path for uploading data to the iServer.
There is a View Log button is on the Details page. For the normal use of the log view feature, make sure that there is an Index pattern with the index name being imanager_logs and Time-filed being @timestamp under index patterns on the management page on Kibana. If not exist, please refer to Appendix > Kibana Creates The Index Pattern to create it.
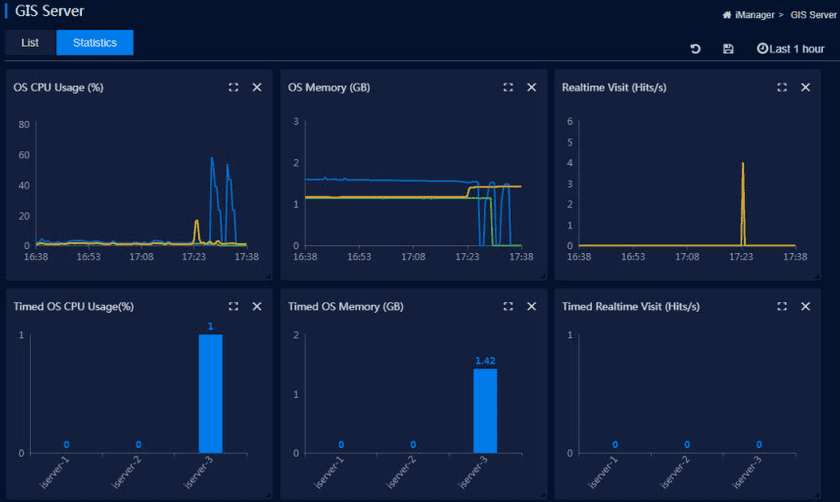
You can check system CPU occupation (%) of all GIS servers, the current CPU occupation (%) of the system, system memory (GB), current memory of the system (GB), and real-time access statistics (hits/sec) and current access statistics (hits/sec) on the GIS Server Statistics page (iManager).


