Tutorial
GIS Big Data Site Details
View the big data site
On the GIS big data site page, view the current system sites and the basic configuration information for each site, such as site name, address, state, and supported operation types.
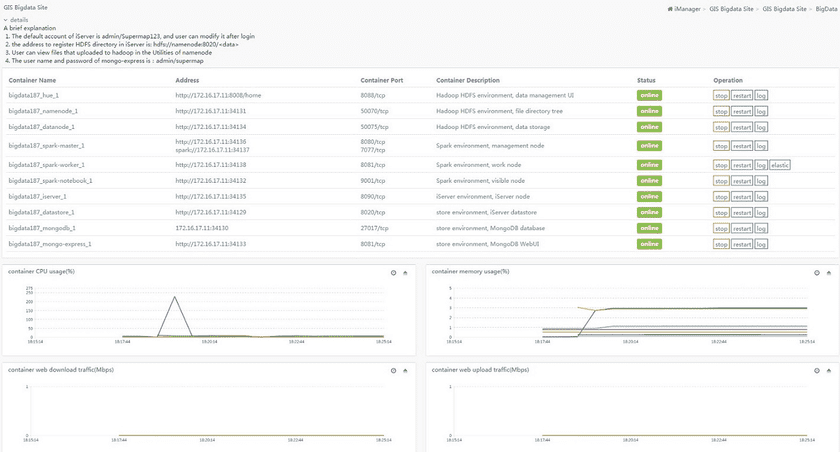
You can view the all the GIS big data site environment created by the current system on the GIS big data site management page. Click the corresponding GIS big data site name or the inside “Details” button to view the corresponding GIS data site detailed information. As follows:
On the detail page, the list section corresponds to the access address of each service or the IP and port required to access the service. Chart part is the load information statistic chart for the current GIS big data site. The displayed monitoring indicators mainly include: container CPU useage, container memory useage, and the upload and download traffic of container. For a single monitoring figure, the upper right corner defines two operations, respectively, from left to right is “Time Period” button and the “Collapse/Expand” button. Time Period button provides the time range to change the query monitoring time, and the Collapse/Expand button is to hide or display the current statistic chart.
Manage the big data site
On GIS big data page site management page, it provides the GIS data site start-up, stop, restart and remove functions. These functions will affect all the containers under the current GIS big data site. The details page of the GIS big data site provides the ability to start, stop, restart, and view log for a single container. These functions only affect the current container, and not other containers.
Part of the container supports elastic scaling, and you can set the umber of the container through the elastic extension button in the action bar.

