


Service area analysis refers to identifying the coverage area that specified service centers can provide on a network under given conditions.
First, understand two fundamental concepts:
- Service Stop: A service center point providing specific services, such as a supermarket, post office, or community clinic.
- Service Area: A region centered around a specified point that includes all accessible network edges within a defined resistance range. Simply put, it represents the service coverage of a facility under specified conditions, like a community police station's jurisdiction within administrative boundaries.
In network analysis, nodes with resource capacity are abstracted as service stops, and their maximum coverage distance is abstracted as service radius. The analysis results show service networks and service areas (polygons). Service area analysis can be considered as resource allocation that focuses on network resistance between suppliers and demanders, without considering resource supply-demand balance. This analysis is typically used to evaluate service coverage of public facilities like post offices, hospitals, or supermarkets, providing references for optimal facility placement.
Parameters
When performing service area analysis, configure settings for handling overlapping service areas and analysis direction.
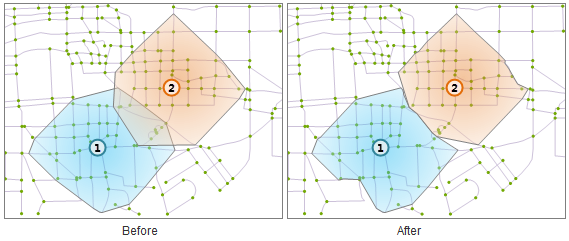 |
| Schematic diagram of service area mutex |
 |
- Analyze from center stop: Determines analysis direction. This setting reflects the relationship mode between service centers and demand points. When enabled, the analysis simulates service centers actively providing services (e.g., milk stations delivering to residences). When disabled, it simulates demand points actively seeking services (e.g., students traveling to schools).
- Service Stop Mutex: Handles overlapping service areas through mutual exclusion based on center point distances. Adjacent overlapping areas will be mutually excluded. The left diagram below shows non-mutex processing, while the right shows mutex processing.
- Generate Complex Area: When enabled, creates precise polygon boundaries based on generated routes. When disabled, generates simplified outlines using nodes. Enabling this option allows setting buffer radius for accurate service area modeling. The diagram below compares results with and without complex area generation.