


Feature Description
Sunlight refers to calculating the duration of time that a specified area can be exposed to sunlight within a certain period based on its latitude and longitude range. Additionally, based on specified maximum height, minimum height, sampling distance, and sampling frequency, it obtains lighting information within the specified area. The lighting value represents the percentage of sunshine time at that location relative to the total analysis time (from start time to end time).
This sunlight is based on GPU for sunlight analysis. Compared to the data-based "Sunlight", it has lower accuracy but can analyze large areas.
This function can be widely applied in fields such as civil engineering, urban planning, and landscape analysis. For example, in urban planning, when selecting sites, the sunlight function can output suitability models as important references.
Function Entry
- 3d analysis选项卡->spatial analysis组->sunlight
Operation Steps
- In the 3D Analysis tab, within the Spatial Analysis group, click the sunlight button to pop up the "3D Spatial Analysis" panel.
- There are three ways to add a sunlight area in the scene: drawing a polygon, mouse select 3D region, and importing a 3D polygon. The specific operations are as follows:
- Click the add button in the toolbar, move the mouse to the scene, left-click on the model data surface to draw the analysis bounds, and right-click to end drawing and confirm the sunlight range. Its drawing operation is consistent with polygon drawing.
- If a 3D region dataset has been added to the current scene, click the mouse select 3D region button in the toolbar, select a 3D polygon as the analysis area, and right-click to end.
- In the "3D Spatial Analysis" panel, select the "sunlight" node, click the import button in the toolbar to pop up the "Import Analysis Range" dialog. In the dialog, select a 3D region dataset as the analysis area to import, and set parameters such as data source, dataset, name, minimum/maximum height, and sampling distance.
- Select one or more analysis records in the analysis record list, and you can perform parameter and property settings in the 3D Spatial Analysis panel.
- Parameters:
- Lighting rate color table: Used to set the display color for the lighting rate in the analysis area. Different lighting rates display different colors.
- Minimum height: Represents the bottom altitude of the analysis area relative to the center point of the drawn polygon, in meters. If set to 1, it means the bottom altitude of the analysis area is the elevation of the center point of the drawn polygon plus 1 meter.
- Maximum height: Default is 20 meters. Represents the top altitude of the analysis area relative to the center point of the drawn polygon, in meters. If set to 10, it means the top altitude is the elevation of the center point plus 10 meters.
- Sampling distance: Refers to the frequency of output sample points within the specified plane and height range, in meters. The default sampling distance is 5 meters, meaning that within the specified analysis bounds and height, a lighting rate sample point is output every 5 meters.
- Time Settings:
- Start time: Used to set the start time for sunlight. You can input the specific year, month, day, hour, minute, and second according to the given time format, or select a time by clicking in the text box and adjusting with the buttons on the right to determine the start time.
- End time: Used to set the end time for sunlight. Similarly, input the specific time or adjust to determine the end time.
- Sampling frequency: Refers to collecting sunlight data at each sample point within the specified start and end time range, in minutes. The default sampling frequency is 5 minutes, meaning that within the analysis time range, it checks every 5 minutes whether there is sunlight at each sample point, and finally calculates the lighting rate for each point.
 Note:
Note:- After setting "Parameters" and "Time Settings", you need to click "Apply" for the settings to take effect.
- Parameters:
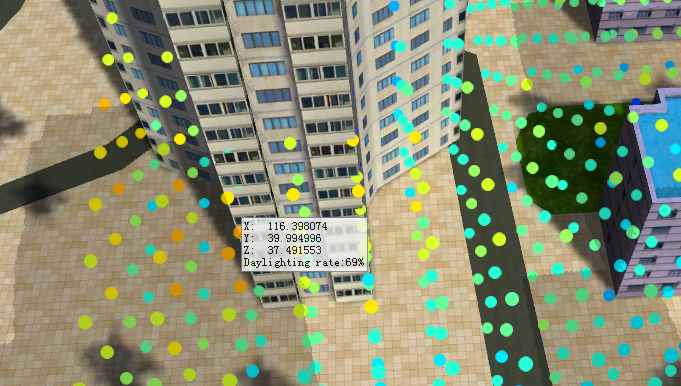
- Based on the set parameters, the lighting rate results within the specified range can be obtained. Check "Lighting Information Query", and when the mouse moves over the sunlight analysis result area in the scene, it will display the coordinate position and lighting rate, which cannot be modified. As shown below:
- The toolbar provides a delete operation for analysis records. Select one or more sunlight records in the panel and click the delete button to remove the selected records.
- Sunlight supports the function of exporting analysis range, which can export the analysis area as 3D polygon data. Click the export button in the toolbar, and in the popped "Export Analysis Range" dialog, set the save name and data source for the exported 3D polygon data, as well as the name, minimum height, maximum height, sampling distance, etc., to be retained in the dataset after export.
- Sunlight supports exporting analysis results, which can export the analysis results as 3D point data. Click the save button in the toolbar, and in the popped "Save Analysis Results" dialog, set the save name, data source, intensity field, etc., for the exported 3D point data.