Instructions for use
The Profile Analysis function can analyze the change of the specified data along the section line or the data contour line cut by the section line according to the specified section line. This function supports importing Line3D as a section line, and supports measurement and coordinate query on the Profile Information diagram obtained by analysis. Maximum/Minimum Elevation and Maximum/Minimum Slope of data can be displayed on the Profile information chart, and the profile Export as Image data can be saved. Support to save Analyst Result as Point Dataset and highlight the model intersected by the section line. This feature is available for Terrain Data and Model Data.
Application scenario
Profile Analysis is widely used in engineering route selection, facility site selection, pipeline layout, coal mining, Land Use planning, etc., for example:
- The profile of Underground Pipelines is output through the Profile Analysis function, and the diameter of pipelines is measured and calculated through the Distance Measure function.
- Profile Analysis can be used to assess the difficulty of road construction or the feasibility of laying a rail line along a given path.
Operation steps
- Add Terrain Data or Model Data to your scene for Profile Analysis and on the 3D Analysis tab, in the Spatial Analysis group, click
 the button. The 3D Spatial Analysis "panel pops up.
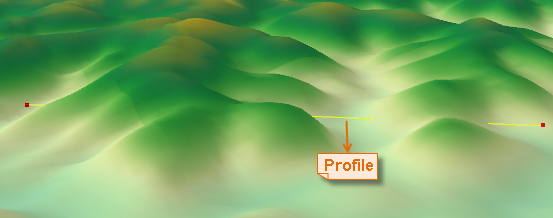
 - Click the Add button and move the mouse over the scene to draw a line anywhere as a section line. Click the left mouse button to start drawing, click the left mouse button again to determine the end point of the section line, click the right mouse button to finish drawing, determine a section line, and pop up the Profile information "dialog box.
- Hatch position:
- Start Info: displays the starting point Position Info of the current section line. You can enter the longitude, latitude and elevation values in the input box to adjust its position.
- Stop Info: displays the end point Position Info of the current section line. You can enter the longitude, latitude and elevation values in the input box to adjust its position.
- Analysis Height: displays the elevation information of the current section line. You can enter the height value in the input box to adjust its position.
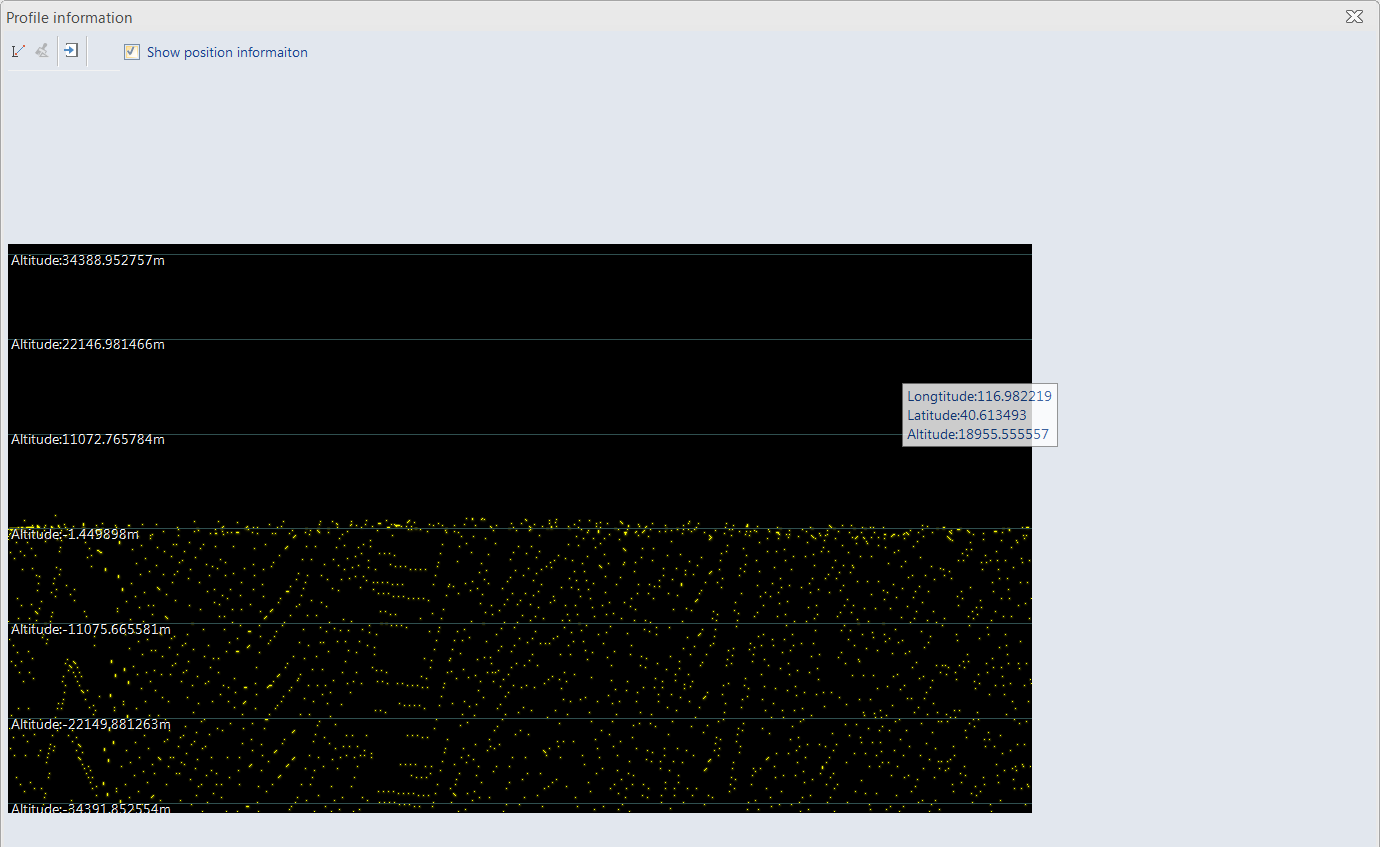
- Profile information: Check the " View profile information" check box to open the "Profile information" dialog box in the scene to perform operations on the Analyst Result.
- HighLight Show Obstacle: Select the " HighLight Show Obstacle" check box to highlight the model intersected with the section line in the scene, and automatically associate the Open attribute table to display the Attributes of the intersected model.
- The toolbar of the Profile information "dialog provides Distance Measure, Export to Image, Save Analysis Results, Show Position Info, Maximum/Minimum Elevation, Maximum/Minimum Slope and other functions. The specific operation instructions are as follows:

Figure: Profile information "Dialog Box - Measurement: Click the "Measurement" button, move the mouse to the Profile information diagram, click the left mouse button to determine the starting point of the measurement, move the mouse, and click the left mouse button again to determine the end point of the measurement path. At this time, the window will display the distance value of the measurement path.
- Clear: Click the "Clear" button to clear the measurement results in Current Windows.
- Export to Image: Click the "Export to Image" button. In the pop-up "Export Image" dialog box, set the path, name and image Save Type for saving the image, and finally click Save. Image output types include: *.bmp, *.jpg, *.png, *.gif, *.tiff.
- Save Analysis Results: Click the Save Analysis Results "button, and in the pop-up Save Analysis Results" dialog box, Set the Datasource, Dataset, graph field name and Model ID Field name saved by Point Dataset.
- Show Position Info: After the check box is selected, move the mouse to the Profile Information in the window to display the Position Info and elevation value of the section line where the mouse is located; if the check box is not selected, the position and elevation information will not be displayed.
- Maximum/Minimum Elevation: When the check box is selected, Maximum/Minimum Elevation is displayed in the Profile information graph and the point where the corresponding value is displayed is identified.
- Maximum/Minimum Slope: When the check box is selected, the maximum/minimum slope and the corresponding Point Information are displayed in the Profile Information graph.


 Button: used to draw the path participating in the Profile Analysis. Move the mouse over the scene to draw a line anywhere as a section line. Click the left mouse button to start drawing, click the left mouse button again to determine the end point of the section line, click the right mouse button to finish drawing, determine a section line, and pop up the Profile information "dialog box.
 Button: used to remove the Profile Analysis record selected in the Analyst Result list.
  Button: Used to import 3D lines or Line Datasets that participate in the analysis.
  Button: Export Profile Analysis results as a picture. In the pop-up "Export Image" dialog box, set the path, name and Save Type of the picture. The image output type supports JPG File, PNG File, Bitmap File, GIF File and TIFF File.
  Buttons: lines that will participate in Profile Analysis and Analyst Result crosshatches Export as Point dataset. In the Save Analysis Results "dialog box, set the Datasource where the Point Dataset is stored, the Dataset Name, the layer stored in the property sheet, and the Model IDField.