


Manual Color Balancing
Instructions
When the color differences among oblique photogrammetry 3D models are too large, you can use the Manual Color Balancing function to adjust parameters such as brightness/contrast, hue/saturation, and levels of the selected data within a specified range, making the colors of multi-source data more consistent.
This function is available starting from SuperMap iDesktopX 2026.
Function Entry
- 3D Geographic Design tab > Oblique Photogrammetry Data operations > Color Balancing drop-down menu > Manual Color Balancing button
Steps
- Create a new globe scene. In the workspace manager, right-click "Scene" and select "New Globe Scene".
- Load 3D tiles. In the layer manager, select the normal layer, right-click and choose "Add 3D Tile Layer", or on the Scene tab in the Data group, click the Tile drop-down button and select "Load Tile..." from the pop-up menu.
- In the layer manager, select the 3D tile layer, right-click and choose "Quickly Locate to This Layer", then hold down the mouse wheel in the scene window to adjust the camera to a perspective convenient for observing the data.
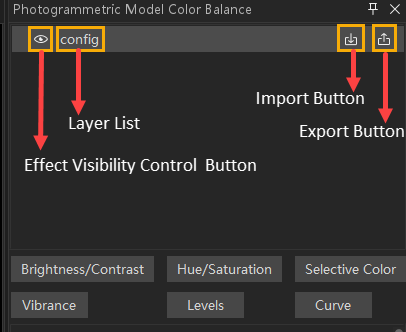
- On the 3D Geographic Design tab, in the Oblique Photogrammetry Operations group, click the Color Balancing drop-down menu, then click the Manual Color Balancing button. The "Oblique Photogrammetry Color Balancing" panel will appear on the right side of the software. The specific parameter settings are as follows:
- Draw: Click the Draw button, then left-click in the scene to start drawing. Move the mouse to define the range, and right-click to finish. After drawing, a corresponding area item will be automatically generated under the layer, used to limit the effective range of the color balancing parameters.
- Delete: In the layer list, select the area to be deleted and click the Delete button at the top of the panel to remove it.
- Layer List: Displays all layers containing oblique photogrammetry 3D models in the current scene, along with the drawn action ranges on each layer.
- Import Configuration File: Click the Import button to import two types of configuration files:
- Import the *.colorAdjWgt file generated by the Intelligent Color Balancing function as a basis for parameter adjustment;
- Import a *.colorAdj configuration file that records color balancing parameters to directly restore the previously adjusted color balancing effect.
- Export Configuration File: Export the current color balancing parameters as a *.colorAdj file and save it to a specified path.
- Use the effect visibility control button to enable or disable the application of color balancing parameters on the entire data or a specified area at any time.
- Feather Radius: After drawing and confirming the action range, this parameter appears in the parameter setting area to soften the transition effect at the edge of the range. The unit is meters.
- Brightness/Contrast Settings: Click the Brightness/Contrast button, and the adjustment module will expand below the panel. Drag the Brightness and Contrast sliders to globally adjust the lightness/darkness and color contrast of the data. Each adjustment module supports enabling/disabling via a check box. Click the delete button to remove the module.
- Hue/Saturation Settings: Click the Hue/Saturation button, and the adjustment module will appear below the panel. It is used for fine-tuning the hue, saturation, and lightness of specific color ranges.
- Color Selection: Select the color range to adjust from the drop-down list. Options include Master, Red, Yellow, Green, Cyan, Blue, Magenta.
- Selecting Master means the adjustment applies to all colors.
- Selecting Red/Green/Blue adjusts the red/green/blue channel (primary colors) of the data color.
- Selecting Cyan/Magenta/Yellow adjusts the cyan/magenta/yellow channel (complementary colors) of the data color.
- Hue: Adjusts the color type. Dragging the slider shifts the selected color range along the color wheel.
- Saturation: Controls the intensity of the color. Higher values increase saturation, making colors more vivid; lower values make colors closer to gray.
- Lightness: Controls the brightness of the color. Larger values make the color brighter, smaller values make it darker.
- Multiple Hue/Saturation modules can be enabled to adjust the hue, saturation, and lightness of different colors separately.
- Color Selection: Select the color range to adjust from the drop-down list. Options include Master, Red, Yellow, Green, Cyan, Blue, Magenta.
- Selective Color Settings: Click the Selective Color button, and the adjustment module will appear below the panel. This module is based on the CMYK (Cyan, Magenta, Yellow, Black) color model and adjusts the color expression by changing the content of these four components in a specific color.
- Color Selection: Select the color range to adjust. Options include: Neutrals (colors without hue), Red, Yellow, Green, Cyan, Blue, Magenta, White, Black. Note: The adjustments here affect the CMYK ink proportions that constitute the color, not the visual hue. For example, adjusting the cyan content in 'Red' actually affects the cyan component of the red area.
- Component Adjustment: Drag the Cyan, Magenta, Yellow, Black sliders to increase or decrease their proportion in the selected color.
- Adjustment Principle: Increasing one color is equivalent to decreasing its complementary color. For example: increasing cyan in 'Red' actually reduces red, making the red darker or tending toward gray; decreasing cyan increases red.
- Vibrance Settings: Click the Vibrance option, and the adjustment module will appear below the panel, making color adjustments more natural.
- Vibrance: Intelligently adjusts the intensity of colors, with a range of [-100,100]. Larger values enhance areas with lower saturation in the image while protecting areas with originally high saturation, avoiding oversaturation, making colors overall more vivid and natural, and less prone to color clipping. Smaller values reduce the saturation of the image but do not completely desaturate it.
- Saturation: Uniformly adjusts the intensity of all colors, with a range of [-100,100]. Larger values simultaneously increase the saturation of all colors, creating a strong visual impact but easily causing color clipping and detail loss in originally vivid areas. Smaller values simultaneously decrease the saturation of all colors, moving closer to black and white.
- Levels Settings: Click the Levels option, and the adjustment module will appear below the panel. It is used for fine control of the image's brightness levels and color balance.
- Color Channel: Select the color channel to apply adjustments from the drop-down list. Options include RGB, R, G, B.
- RGB: Applies simultaneously to the red, green, and blue channels, mainly adjusting the overall brightness and contrast of the image.
- R (Red), G (Green), B (Blue): Independently adjust the brightness distribution of a single color channel.
- Input Levels: Controls which brightness values in the data will be mapped to the darkest, midtones, and brightest, thereby enhancing or reducing contrast.
- Shadows (Black point): Sets the mapping point for the darkest part of the data. Values below this are mapped to pure black.
- Midtones (Gray point): Adjusts the brightness distribution of midtones, with a range of [0.01, 9.99]. Smaller values make midtones brighter, lightening the overall data, while highlights are less affected. Conversely, larger values darken midtones, darkening the overall data, while shadows are less affected.
- Highlights (White point): Sets the mapping point for the brightest part of the image. Values above this are mapped to pure white. The range is [4, 255]. Larger values make the highlight area brighter, enhancing overall contrast; smaller values darken the highlight area, which can recover overexposed details.
- Output Levels: Limits the brightness output range of the adjusted data.
- Shadows: Limits the brightness value of the darkest pixel in the output data (original pure black is mapped to this value). The range is [0, 255]. Larger values brighten the darkest areas, making shadow details more visible but reducing contrast.
- Highlights: Limits the brightness value of the brightest part of the output data (original pure white is mapped to this value). The range is [0, 255]. Smaller values darken the brightest areas, preserving highlight details but reducing contrast.
- Color Channel: Select the color channel to apply adjustments from the drop-down list. Options include RGB, R, G, B.
- Curve Settings: Click the Curve option, and the adjustment module will appear below the panel. It allows fine control of image contrast and tone by adjusting the brightness mapping curve.
- Color Channel: Select the color channel to apply adjustments from the drop-down list. Options include RGB, R, G, B.
- RGB: Works simultaneously on all color channels, mainly adjusting the overall brightness relationship and contrast of the data.
- R (Red), G (Green), B (Blue): Independently adjust the brightness curve of a single color channel.
- The curve chart uses a histogram as the background, reflecting the brightness distribution. Click on the curve to add control points and drag them to adjust the brightness mapping.
- Input (Horizontal axis): Original pixel brightness value.
- Output (Vertical axis): Adjusted pixel brightness value. By changing the shape of the curve, you can remap the brightness relationship.
- Color Channel: Select the color channel to apply adjustments from the drop-down list. Options include RGB, R, G, B.
- After settings are complete, the adjustment effect is displayed in real time, and parameters can only be saved by exporting. The parameters are not retained when the scene is closed. To reapply them to the data, import the saved parameter file.
