When multiple Label Features are placed in the map, there will be areas where text, labels, thematic map elements, etc. Are displayed too densely, and these features will overlap each other, thus reducing the readability of the map. Overlap SettingsHelp controls the display of text, labels, thematic map elements and other objects in the map, which is conducive to better handle the display of various types of objects in the map, and ultimately obtain a more satisfactory map Display Effects.
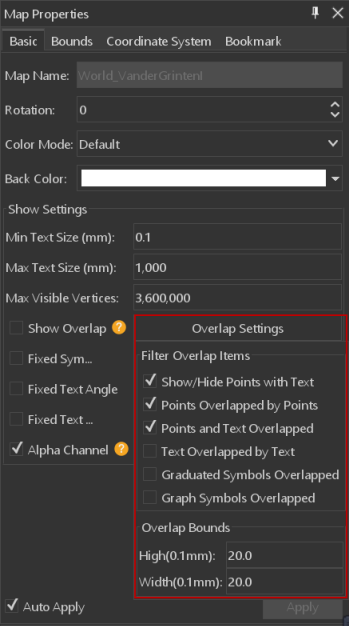
As shown in the following figure, click the Map Properties button in the Properties group of the Map tab, and click the Overlap Settings "button in the pop-up right docking window, as shown in the following menu. You can use the items in this menu to set the capping conditions individually.
 |
| Image: Overlap Settings menu |
Show Overlap
This check box is used to control whether to display the objects with capping. If this check box is checked, All Objects with capping will be displayed and the Overlap Settings Drop Down Button will be grayed out. If the check box is not checked, detailed settings can be made in Overlap Settings.
Overlap Settings
Overlap Items
You can control the display between different types of capping objects. The objects being capped can be on the same layer or from different layers. Note: When two objects are overlaid, if Show Overlap is set, the covered object below will be displayed first, and the object above will not be displayed.
- Show/Hide Points with Text
If the dots in the dot layer are dense and the Thematic Label Map is made, the No Overlap function of the Thematic Label Map will remove the labels with overlapping covers, thus forming the illusion of No labels for individual dots; If No Overlap is not used, there will be a gland between the labels. The Show/Hide Points with Text function controls the filtering display of the layer and the label of the Thematic Label Map based on the layer. Select the Show/Hide Points with Text "check box to prevent a point from being displayed if its label is hidden.
>
- Display points overlapped by points
When a point object in the same layer or a point object in a different point layer in the map is covered by other point objects, you can control whether to display the point objects that cover each other. Check to indicate that the point objects showing the occurrence of capping will also be displayed, otherwise only the point objects located below will be displayed and the point objects located above will not be displayed.
- Display points and text that overlapped mutually
The text contains the text annotation of the Thematic Label Map and the text of the text layer (CAD layer). When point layers and Thematic Label Map or text layers (CAD layers) in a map are blanked, you can control the display of objects and text (including labels) that appear blanked to each other. Check to show the point and Text where the overlay occurs; otherwise, only the point or Text below will be displayed, and the object on top of it will not be displayed. Note: This does not control the gland between Text and the gland between point objects.
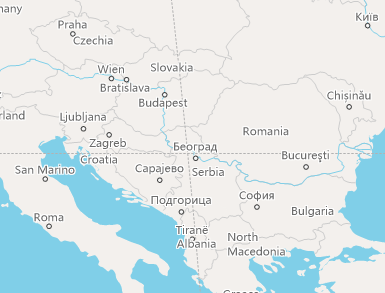
As shown in the following figure, the left figure is the original map, and "Display points and text that overlapped mutually" Overlap Items "is selected by default; the right figure does not display the effect of capping points and Text. Because the label layer (text) is on top of the point layer, once the points and text are overlaid, the Text will be filtered out and only the point object will remain when the Display points and text that overlapped mutually "checkbox is selected.
An object that that

displays points and text pressed against each other Objects do not display points and text against each other - Display text overlapped by text
The text contains the text annotation of the Thematic Label Map and the text of the text layer (CAD layer). When overlays occur between text or labels in a Thematic Label Map layer or a text layer (CAD layer), you can use the Display text over lapped by text "option to control their capping. Select the "Display text over lapped by text" "check box, and do not process the overlapped Text, that is, Show All the overlapped Text; Otherwise, Display Control is performed on the overlapped object, that is, the object located below is reserved, and the object overlapped above is not displayed. Note: Whether to execute the "No Overlap" "function will be judged first in the Thematic Label Map layer.
As shown in the following figure, the left figure is the original map, with the "Display text overlapped by text" "option selected and the" Show All "superimposed Text; In the figure on the right, the Display text overlapped by text "option is not selected, and only the Text below is displayed, while the Text overlapped with it is not displayed.


Display text overlapped by text No, Display text over lapped by text. - Display the overlapped graduated symbols There is a high probability of overlapping between the Graduated Symbols in the
- Display the overlapped graph symbols
Statistical Symbols Thematic Map, and these overlapping objects can come from one or more layers. With the "Display the overlapped graduated symbols" option Set Parameters, you can control the display of the elements of the grade thematic map in which the overlapping occurs. If this check box is selected, Display Control will not be performed, and all the overlapped Graduated Symbols will be displayed; otherwise, the overlapped objects will be filtered, that is, only the objects below will be displayed, and the objects above will not be displayed.
If the statistical symbols in the map thematic maps (such as pie charts and bar charts) may occur between the statistical symbols of the layers, these statistical symbols can exist in one layer or multiple layers. You can control the display of statistical symbols that overlap each other through the "Display the overlapped graph symbols" option in the Overlap Settings menu. Selecting this check box does not control the display of statistical symbols. All superimposed statistical symbols are displayed; otherwise, only the statistical symbol object below is displayed, and the statistical symbol object above is not displayed.
Overlap Bounds Settings
The Overlap Bounds "is used to set the gland spacing between two objects, which is determined by specifying the width and height. For example, if the width and height of Overlap Bounds are set to 60 and 40 respectively, the actual Overlap BoundsCal culator Method is 60 units to the left and 40 units up and down with the Bounds of Text as the boundary. The unit is 0.1 mm. Overlap Bounds are applicable to all of the above 5 gland cases.
Positive Overlap Bounds (width or height of Overlap Bounds) indicates the distance between the two objects. Is no more than distance is displayed; A negative number indicates the capping distance between two objects. Is no less than absolute value of the distance is displayed. Is no less than absolute value of the distance is not displayed.
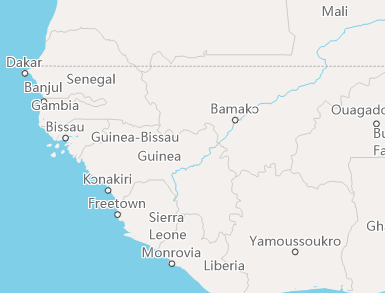
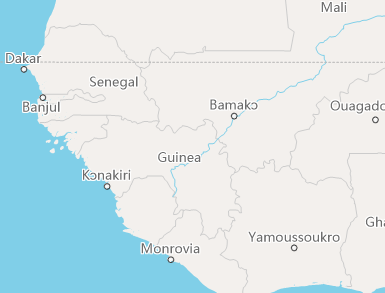
As shown in the following figure, Overlap Bounds is not set in the left figure, and the Application controls the display of the text according to the filtering options set previously. Display Effects of Overlap Bounds (20 mm in width and 20 mm in height) is set in the right figure. Application filters other objects that fall within this range for each text.
 |
 |
| Overlap Bounds are not set | Overlap Bounds are 20 wide and 20 high |


