


Multiple Traveling Salesman Problem (MTSP) Analysis, also known as multi-traveling salesman problem (TSP) analysis, refers to finding the most economical and effective delivery paths and corresponding transportation routes in a network dataset, given M distribution centers and N MTSP stops (where M and N are integers greater than zero). The MTSP Analysis functionality provided by SuperMap GIS Desktop aims to solve how to allocate delivery sequences and routes for each vehicle to minimize total transportation costs or achieve optimal cost for each distribution center.
The application provides two delivery strategies: minimum total cost and global average optimization. By default, the minimum total cost strategy is used, which may result in uneven cost distribution where some MTSP center stops incur higher costs than others. The overall average cost strategy controls expenditure for each MTSP center stop to achieve relative balance among distribution centers, though total cost may not be minimized in this case.
Application Scenario
In a region with three large agricultural wholesale markets supplying 13 community markets, three delivery vehicles depart daily from their respective MTSP center stops to deliver goods. Each vehicle needs to follow optimal delivery sequences while ensuring minimal total transportation costs. The MTSP Analysis provided by SuperMap can effectively address such logistical challenges.
The analysis results visually display optimal delivery routes on the map, accompanied by an attribute table recording node information and cost details for each delivery segment. As shown in the illustration below: red icons represent MTSP center stops, brown icons indicate MTSP stops, and differently colored routes distinguish delivery paths.
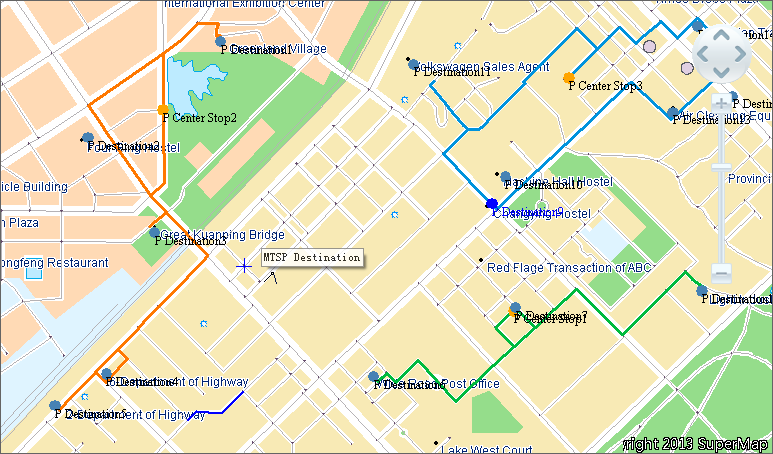 |
| MTSP Analysis Results |