As digital maps reflect increasingly rich and comprehensive information, map elements often overlap with each other. In particular, annotation texts used to convey map feature information are more detailed and prone to overlapping with each other or with map elements. This is the issue of map annotation conflicts. So, how can we handle these overlapping problems based on cartographic needs?
Usually, annotation overlaps occur due to excessive annotation density. By controlling reasonable annotation density, we can solve some overlapping issues and ensure a certain level of information by placing more annotations appropriately. However, this section discusses some special ways to handle annotation conflicts, often involving specific overlapping treatments based on cartographic requirements.
- Show and Not Show Overlap
When map annotations overlap, the simplest and most direct way to handle it is to hide the overlapping content. At this point, just ensure that "show overlap" in the Map Properties panel is unchecked to hide all overlapping map annotations, including overlapping maps.
You can also check "show overlap" to view hidden overlapping objects. Additionally, through the Collision Detection function in the Cartography group under the Map tab, hidden overlapping objects can be displayed prominently in the map with special styles. As shown in the figure below, red labels indicate conflicts with other labels.
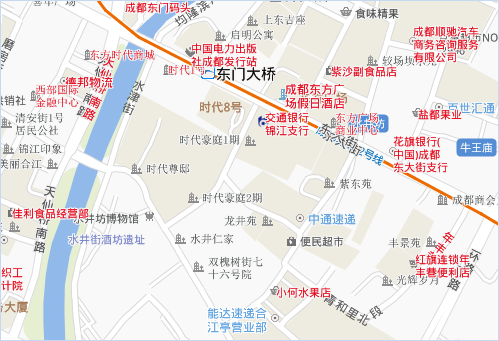
Figure: Red labels indicate display conflicts - Customizing Overlap Bounds to Achieve Object Thinning
By default, when the distance between two objects is no more than 0, they are considered overlapping. SuperMap software allows user-definable overlap tolerance, which defines when a distance between objects constitutes overlap. Click the Overlap Settings button in the Map Properties panel; in the opened list, the Overlap Bounds area allows you to specify a rectangular range that serves as the object's extent. Any object intersecting this range will be considered overlapping.
Customizing overlap bounds can also achieve object thinning from another perspective. In the section on controlling reasonable annotation density, thinning dense annotations is achieved through "text avoidance cache bounds." Customizing overlap bounds for thinning extends beyond annotations to include point objects.
Note: Overlap bounds settings apply to the entire map, not specific layers, so the results of setting cache bounds are global for the map.
As shown in the figure below, this is a label thematic map without text avoidance cache bounds set, but with "show overlap" unchecked and "no overlap" enabled. The labels are very dense. By setting overlap bounds to 25 (unit: 0.1mm), the labels achieve a rarefy display effect, as shown in the figure; after zooming in or out, the system adjusts in real-time based on the set tolerance.
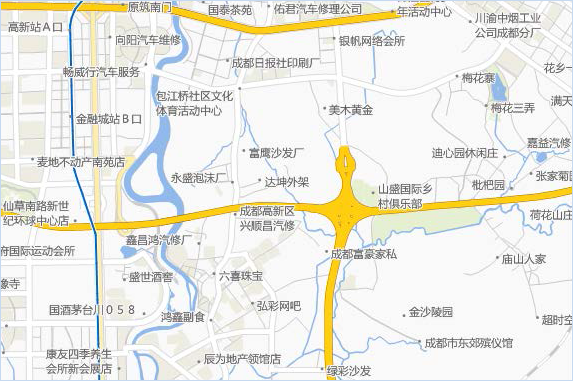
Figure: Effect of setting overlap bounds - Hide Point Objects with No Labels
During map data creation, intermediate results may exhibit the phenomenon shown below. As in the figure, the boxed area has overlapping labels for point objects, and with "hide overlapping objects" enabled, text labels are hidden. This typically indicates incomplete information expression on maps, so we must either display the labels or hide the point objects without labels. The former approach is challenging; thus, hiding point symbols with no labels is preferable. SuperMap iDesktopX provides a simple operation: just check the Show/Hide Points with Text option in overlap items to achieve this.
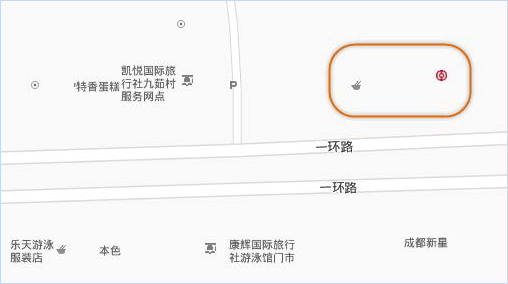
Figure: Point objects with missing labels Click the Overlap Settings button in the Map Properties panel, and in the opened list, check the box before Show/Hide Points with Text. The effect after setting is shown below.
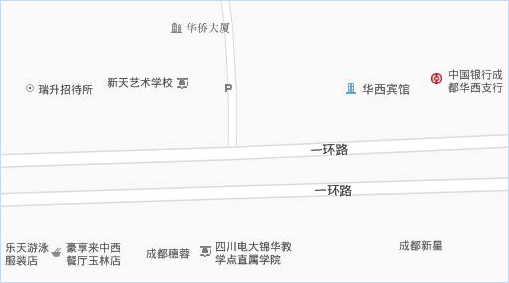
Figure: Map effect after show/hide points with text - Show Hidden Graduated Symbols
Graduated symbol thematic maps use marker size to display quantitative statistical features, so graduated symbols inevitably overlap. By default, maps do not show any overlapping objects, resulting in the effect shown in the left figure below. Clearly, statistical information expression is incomplete. Usually, we do not enable showing hidden graduated symbols in the state shown in the right figure, as such display effects have poor readability.
Through the graduated symbol thematic map properties dialog, when setting the grade marker style, adjust the A value (Alpha value) of the grade color to make graduated symbols semi-transparent. Then, showing overlapping graduated symbols in this state achieves both aesthetics and readability, as shown below.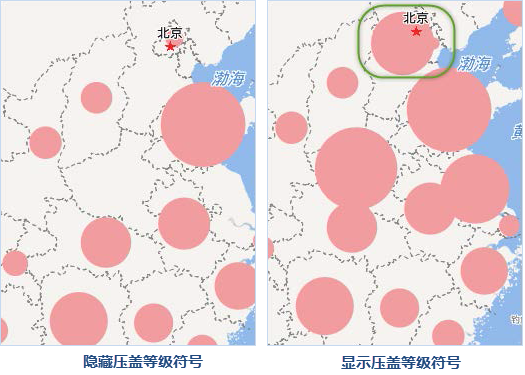

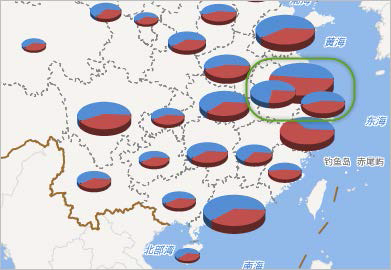
- Show Hidden Statistical Symbols
Overlapping statistical elements do not convey information through statistical charts, so such overlapping statistical elements can be displayed without hiding.
Click the Overlap Settings button in the Map Properties panel, and in the opened list, check the box before Display the overlapped graph symbols to show hidden statistical thematic map elements due to overlap.