Feature Description
A profile represents the variation of surface elevation along a line (section). Studying the topographic profile of a section helps summarize the terrain, geological, and hydrological characteristics of the study area, including landform morphology, contour shape, absolute and relative heights, geological structures, slope features, surface cutting intensity, and erosion factors. This is highly beneficial for assessing the difficulty of road construction or the feasibility of laying railway lines along a specified route, and can also serve as a basis for calculating earthwork volume.
The profile function provided by the SuperMap application is used to view the profile of a raster surface along a given line and obtain related profile information. Depending on the functional entry, the form of the profile information obtained varies.
Sampling Points
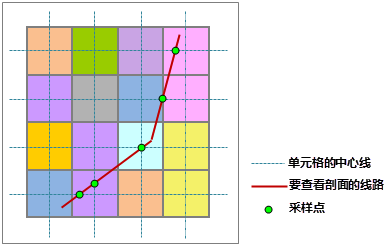
The raster surface is continuous, but it is impractical to continuously represent all positions along a given route. Therefore, it is necessary to select some characteristic points along this line, known as sampling points. The profile effect is displayed through the elevation and coordinate information at these sample points' locations. As shown in the figure below, the positions where the given line intersects the center lines of raster cells are taken as sampling points.
 |
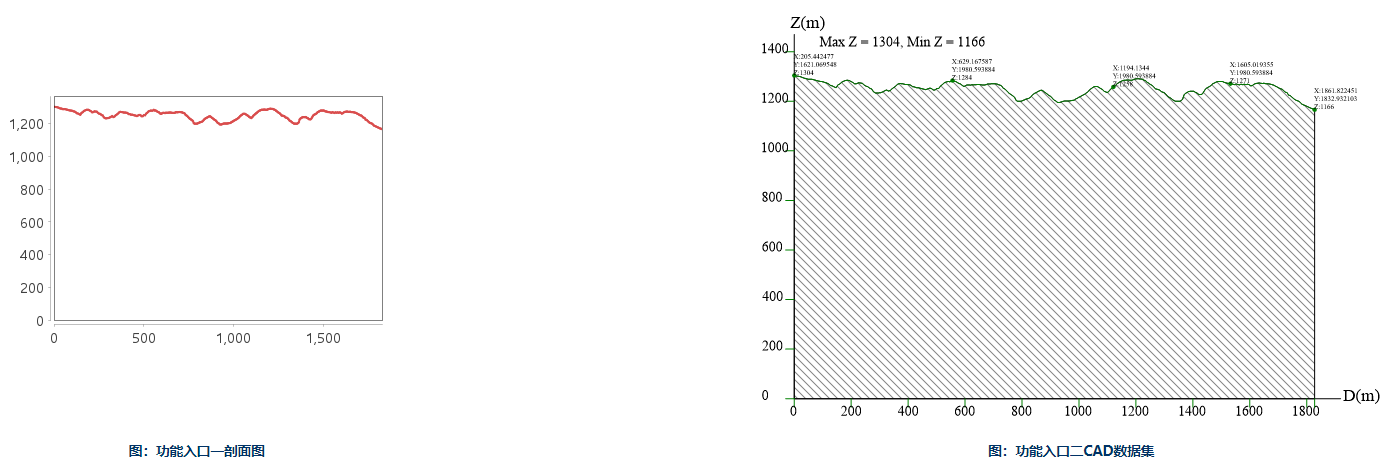
Schematic Diagram of Profile Information
The figure below shows a schematic diagram of the profile line in a two-dimensional coordinate system. Through the profile line, one can intuitively understand the elevation fluctuations of the terrain along the given route.
 |
Functional Entry
- Spatial Analysis tab -> Raster Analysis group -> Surface Analysis -> Terrain Calculation -> Profile.
- Toolbox -> Raster Analysis -> Surface Analysis -> Terrain Calculation -> Profile.
Parameter description
Functional Entry One: Spatial Analysis tab -> Raster Analysis group -> Surface Analysis -> Terrain Calculation -> Profile
- Distance unit: Used to set the unit of the horizontal and vertical coordinates. The drop-down menu supports switching between kilometers, yards, miles, and feet, with the default value being meters;
- The maximum values of horizontal and vertical coordinates are consistent.: Used to specify whether the maximum values of the horizontal and vertical coordinates are consistent. If selected, the maximum values and spacing of the horizontal and vertical axes are the same; if not selected, the maximum value and spacing of the horizontal axis are automatically and evenly distributed based on the data length.
- Customize Y-axis Extreme Value: Checking its checkbox allows customizing the maximum and minimum values of the Y-axis in the profile chart. The X and Y axes are displayed with intervals of 200 units. If the custom value is not a multiple of 200, the custom value is not displayed on the axis.
- Output Sample Point: Save the sampling points as a point dataset. The dataset includes the latitude and longitude coordinates, elevation values, and the Euclidean distance from each point to the start of the line.
- Export as Image: Export the profile chart as an image format.
- Raster Layer: The raster layer list displays all raster data in the current layer manager. Users can select the layer for which the profile is to be generated from the raster layer.
- Settings: Line sets the method for adding lines. "Draw line" allows directly drawing a polyline on the map, while "Select line" requires adding a line dataset to the layer manager to select a line on the map.
- Display the selected sampling point on the map: Checking its checkbox displays the position of the point on the line in the map when the mouse moves over the profile chart.
Functional Entry Two: Toolbox -> Raster Analysis -> Surface Analysis -> Terrain Calculation -> Profile
- Source Dataset: Select the data source containing the raster data for profile generation, and the raster dataset.
- Line: Select the data source containing the route data, and the line dataset. If the line data contains multiple line objects, multiple CAD datasets will be generated.
- Result Data: Select the data source for the generated CAD dataset, and set its name in the dataset.
- Create the Sampling Points Dataset: Checking its checkbox generates a sampling point dataset with the same name alongside the CAD dataset.
- The maximum values of horizontal and vertical coordinates are consistent.: Used to specify whether the maximum values of the horizontal and vertical coordinates are consistent. If selected, the maximum values and spacing of the horizontal and vertical axes are the same; if not selected, the maximum value and spacing of the horizontal axis are automatically and evenly distributed based on the data length.