


Feature Description
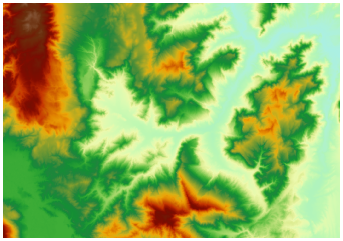
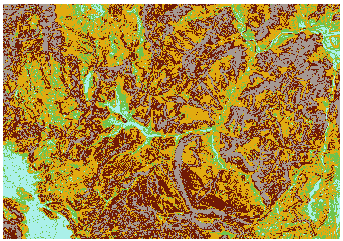
Regional statistics is the statistics on a raster dataset based on a certain dataset. It divides raster data according to zones, disregarding adjacency relationships between raster cells, performs statistics on the raster data within the same zone, assigns the same value to all raster cells within the same zone for output, and ultimately produces a new raster dataset. For example, regional statistics can be used to calculate the average population density within each pollution zone, vegetation types at the same elevation, or land use types within each same slope zone. The following example uses slope classification raster data of a certain area as zonal data and elevation data as value data to calculate the average elevation within the same slope zones.
 |
 |
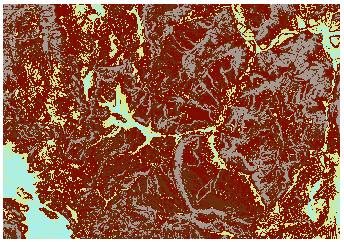 |
| Value Data (DEM Data) | Zonal Data (Aspect Data) | Average Value Result |
The SuperMap application provides 10 statistical models, including:
- Min: Finds the minimum value of raster cells within a zone.
- Max: Finds the maximum value of raster cells within a zone.
- Average: Calculates the average value of all raster cells within the zone.
- STDEV: Calculates the standard deviation of all raster cells within the zone.
- Sum: Calculates the sum of raster cell values within the zone.
- Variety: Counts the number of distinct values present among raster cells within the zone.
- Range: Calculates the range of raster cell values within the zone, which is the maximum value minus the minimum value.
- Majority: Identifies the value that occurs with the highest frequency among raster cells within the zone.
- Minority: Identifies the value that occurs with the lowest frequency among raster cells within the zone.
- Median: Identifies the middle value when all raster cell values within the zone are sorted in ascending order.
When using the Ignore No Value option, zonal data with no values will not participate in the statistics. The figure below shows regional statistics performed on two raster datasets, with the statistical model set to Maximum. The setting for handling no-value data is Ignore No Value. From this example, it can be seen that the no-value data ignored is from the value dataset, while the no-value data in the zonal data is still considered.
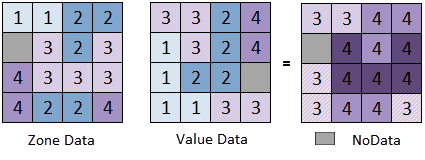 |
| Figure: "Regional Statistics" Schematic Diagram |
Function Entries
- Spatial Analysis tab -> Raster Analysis group -> Raster Statistics -> Regional Statistics.
- Toolbox -> Raster Analysis -> Raster Statistics -> Regional Statistics.
Parameter Description
- Value Data: Select the value data (raster data) to be statistically analyzed, including the data source and dataset where the raster data is located.
- Zonal Data: Select the zonal data to be analyzed. Zonal data can be a vector area dataset or a raster dataset. Currently, regional statistics only supports raster datasets with pixel formats of 1-bit (UBit1), 4-bit (UBit4), single-byte (UBit8), and double-byte (Bit16).
- Identifies the field: The field in the vector area dataset used to identify zones. The field type only supports int. By default, the vector dataset's SMID is used for statistics. The identifies the field cannot be set for raster datasets.
- Statistical model: Select the statistical model to use. There are 10 types available, including Min, Max, Average, STDEV, Sum, Variety, Range, Majority, Minority, and Median.
 Notes:
- Raster data with a floating-point pixel format does not support the Variety, Majority, and Minority statistical models.
- Ignore No Value: When Ignore No Value is checked, the statistics only consider cells with values in the value raster data. Otherwise, no-value cells will be included in the statistics.
- Result Data: Set the result data. The result of regional statistics is output as a raster dataset. You need to set the data source for saving the result data, as well as the name of the raster data and the attribute table name. Note: The name of the raster result dataset and the attribute table cannot be the same.
Explanation of the result:
Raster Result Dataset: Raster cells of different colors represent a zone, and the statistical result for that zone is directly assigned as the value for all raster cells within it. For example, if the statistical model selected during regional statistics is Average, then the raster cell values in the result raster dataset represent the average size of the values for all raster cells within that zone.
Tabular Dataset: Saves the results for the zones according to the statistic field. The attribute table contains the results of all statistical models (Max, Min, Average, STDEV, etc.) as well as the number of cells within the zone (PixelCount), making it convenient for you to view them collectively.
Related Topics