


Feature Description
The kernel density analysis feature calculates the density of point and line feature measurement values within neighboring ranges to visually reflect the distribution of dispersed measurements across continuous areas. The result is a smooth surface with higher values at the center that gradually decrease towards the periphery, where raster values represent unit density and drop to zero at neighborhood boundaries.
This analysis can be applied to calculate population density, building density, crime incident reporting, tourist area population monitoring, chain store performance analysis, etc. Examples include:
- Analyzing population distribution in an area containing high-rise apartments by distributing each building's population count through a kernel function within specified circular neighborhoods, enabling informed decisions for store locations or crime rate estimation.
- Evaluating customer distribution for retail chain stores based on distance fields, assuming customers prefer the nearest location.
- Assessing environmental impact of proposed roads/pipelines on wildlife habitats using influence measurement fields.
Principle
The kernel function used in this analysis is:
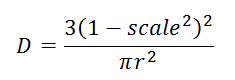 |
Where r represents the search radius, and scale denotes the ratio between grid center-to-feature distance and search radius.
For point features, the volume under the kernel density surface approximates the measurement value. For line features, it approximates the product of measurement value and line length. Density values accumulate in overlapping neighborhoods, with each output raster cell value representing the sum of all kernel surface contributions.
The result raster unit is the inverse square of the original dataset unit (e.g., per square meter for meter-based datasets). Note: GCS datasets produce "per square degree" values without physical meaning.
Open the Shop datasource in "ExerciseData/RasterAnalysis" containing point data of chain store member distribution for demonstration.
Feature Entry
- Spatial Analysis Tab->Raster Analysis group->Density Analysis->Kernel Density Analysis.
- Toolbox->Raster Analysis->Density Analysis->Kernel Density Analysis.
Parameter Description
Displays/sets analysis extent (default: dataset bounds).
The following diagram shows membership distribution analysis for a retail chain:
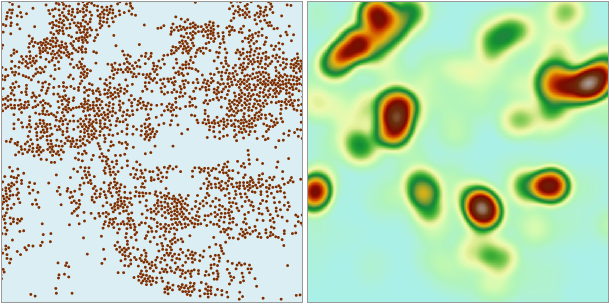 |
| Figure: Kernel Density Analysis Result |
The analysis result reveals dense member distribution in darker-colored areas and sparse distribution in lighter regions.
- Source Dataset
- Datasources: Select the datasource containing input datasets.
- Dataset: Choose point/line datasets for analysis (automatically filtered).
- Density Field: Select numerical measurement field (non-numeric fields excluded).
- Search Radius: Define radius where all sample points contribute to cell density calculation.
- Analysis Bounds
- Result Data
- Datasource: Select output datasource.
- Dataset: Specify result dataset name (existing names trigger invalid prompts).
- Resolution: Set cell size matching dataset units.