


The storage structure of chart data is closely related to the IHO international electronic chart standards and plays a crucial role in chart conversion, display, and publication.
S-57 Data Storage
Feature Objects and Spatial Objects
In the S-57 standard, all objects describing real-world entities are divided into two categories: feature objects and spatial objects. Feature objects describe entities without positional or geometric properties. Spatial objects involve the spatial location and shape of entities, primarily used to describe spatial positional characteristics.
Feature objects typically do not contain positional data but determine their locations by establishing relationships with one or more spatial objects. Spatial objects must be associated with a feature object. This relationship helps construct the spatial representation of chart elements. As shown below:
| Figure: Relationship Between Feature Objects and Spatial Objects |
Chart Topology
-
Chart Data Model: The SuperMap chart data model is built according to the S-57 standard. Real-world entities are defined as combinations of feature objects and spatial objects. Spatial objects are expressed as points, lines, or polygons, each containing attributes, geometric shapes, and spatial positions.
-
S-57 Spatial Description: S-57 categorizes spatial characteristics into three types: vector, raster, and matrix, with a focus on vector spatial objects. Vector object spatial relationships can be divided into four topological levels: no topology, chain-node, planar graph, and full topology.
-
Topological Structure: Charts adopt chain-node topology, which includes three types of spatial objects: isolated nodes, connected nodes, and edges. This topology describes how feature objects reference spatial objects to determine their spatial information. For example, point objects may reference isolated or connected nodes; line objects reference edges and sequences of connected nodes; polygon objects reference closed edge loops.
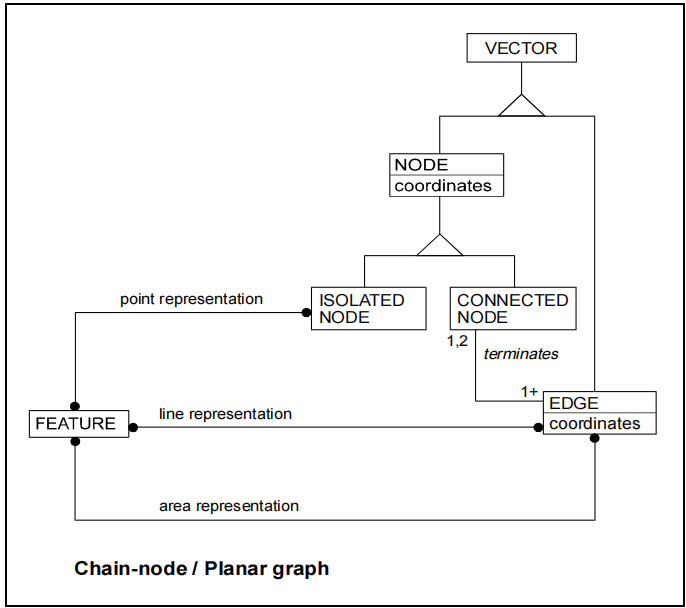 |
| Figure: Chain-Node Model |
Chart Data Storage Structure
S-57 electronic charts use the chain-node topology structure and are encapsulated according to the ISO/IEC 8211 standard. To enhance compatibility with traditional GIS systems, chart data adopts a layered storage structure: point/line/polygon datasets store feature object information, while attribute tables record inter-object relationships and reference information.
Given the extensive feature objects in chart data, this structure often results in hundreds of datasets per chart (each corresponding to a feature object type), making management challenging. Therefore, chart dataset groups are employed for organization.
Chart data grouping facilitates efficient storage and modification. Multiple datasets within a chart group can work collaboratively for data exchange, editing, and publication. The storage structure in SuperMap is illustrated as follows:
- Datasources and Chart Groups: A SuperMap datasource contains one or more Chart Groups (Exchange Sets, the standard units for data exchange), classified as Editable Chart Groups or Non-editable Chart Groups. Chart editing must be performed at the group level.
- Feature Datasets: A chart group contains one or more Datasets, also called feature datasets. Each dataset corresponds to a file during storage.
- Objects: Each dataset stores one or more Objects, where each object corresponds to a record. Objects can form aggregation or master-slave relationships.
- Fields and Subfields: Each object contains standardized fields (object attributes). For example, the Feature Object Identifier (FOID) serves as a unique identifier, also known as the object's "long name", Feature Record Identifier (FRID), and object type. Fields contain corresponding subfields as required by specifications. For instance, FOID includes three subfields: AGEN, FIDN, and FIDS; FRID contains multiple subfields such as RCID (record identifier) and RCNM (record name).
- Objects: Each dataset stores one or more Objects, where each object corresponds to a record. Objects can form aggregation or master-slave relationships.
- Feature Datasets: A chart group contains one or more Datasets, also called feature datasets. Each dataset corresponds to a file during storage.
Related Topics