Feature Description
Generates Thiessen polygons based on given point datasets. Thiessen polygons can be used for qualitative analysis, statistical analysis, proximity analysis, etc. For example:
- Use properties of discrete points to describe polygon regions
- Calculate polygon area data using discrete point data
- Determine adjacent discrete points through polygon edges (n-sided polygon indicates n neighboring points)
- Directly identify nearest discrete points without distance calculation when data points fall within polygons
Definition
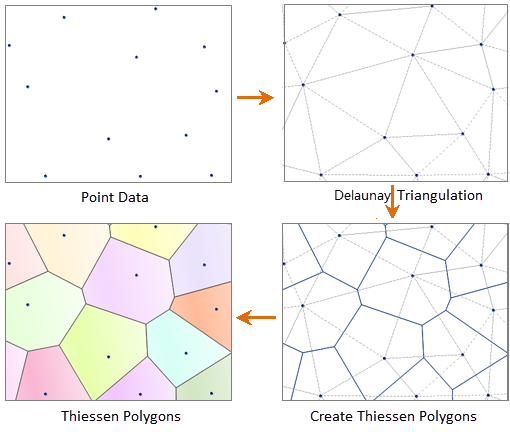
Thiessen polygons, proposed by Dutch climatologist A.H.Thiessen for calculating average rainfall, are created by:
- Connecting adjacent weather stations into triangles
- Drawing perpendicular bisectors of triangle edges
- Forming polygonal areas bounded by these bisectors
Each polygon contains one unique station, representing regional rainfall intensity. Also known as Voronoi diagrams, Thiessen polygons exhibit three key characteristics:
- Each polygon contains exactly one discrete point
- All locations within a polygon are closest to its contained point
- Points on polygon edges are equidistant to two neighboring discrete points
Applications
Thiessen polygons enable spatial partitioning and nearest-point allocation, serving as alternatives to interpolation for generalizing sample measurements. Typical use cases include:
- Generalizing climate measurements from stations to surrounding areas
- Creating service areas for retail stores
- Conducting proximity analysis for facility planning
Parameter Description
| Parameter | Default | Description | Type |
|---|---|---|---|
| Source Dataset | - | Source point dataset for constructing Thiessen polygons | DatasetVector |
| Target Datasource | - | Datasource storing result dataset | Datasource |
| Result Dataset Name | - | Name of output dataset | String |
Output
| Parameter | Description | Type |
|---|---|---|
| Result Dataset | Generated polygon dataset | DatasetVector |
Use Case
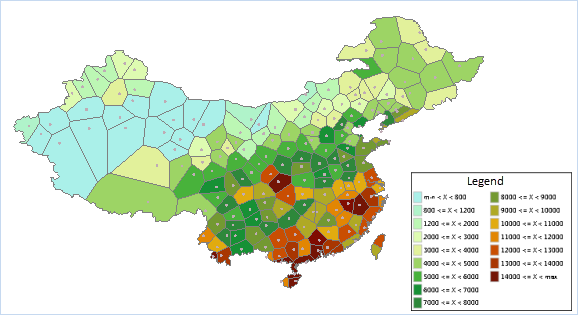
This example constructs Thiessen polygons using nationwide meteorological station data, transferring point attributes to polygonal regions. The resulting polygons represent average rainfall areas for each station. A segmented thematic map created from this data enables analysis of regional rainfall distribution patterns, as shown in the national rainfall distribution map below: