


Feature Description
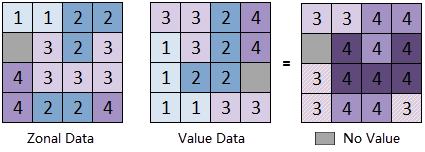
The zonal statistics tool performs raster value statistics based on specific regional boundaries. It disregards adjacency relationships between raster pixels, partitions the raster data by zones, and calculates statistics for pixels within the same zone. The output is a new raster dataset where all pixels in the same zone are assigned the same statistical value.
Multiple statistical modes are supported, including Minimum, Maximum, Mean, Standard Deviation, Sum, Range, and Median. The example below demonstrates the Maximum statistical mode with the "Ignore NoData" option enabled. NoData pixels are excluded from calculations, and only valid pixels determine the output value for each zone.
Parameter Description
| Parameter | Description | Type |
|---|---|---|
| Zone Dataset | Input zone dataset (supports vector polygon or raster datasets). For raster zone datasets, only pixel formats of 1-bit (UBit1), 4-bit (UBit4), 8-bit (UBit8), or 16-bit (Bit16) are supported. | Dataset |
| Value Dataset | Raster dataset to be analyzed. | Dataset |
| Statistics Mode | Statistical method: Minimum, Maximum, Mean, Standard Deviation, Sum, Range, or Median. | GridStatisticsMode |
| Zone ID Field | Field identifying zones in the vector dataset (32-bit integer type required). Defaults to the SMID field if unspecified. | String |
| Ignore NoData | Whether to exclude NoData pixels from calculations. Checked: Only valid pixels are used. Unchecked: NoData pixels remain in the output. | Boolean |
| Target Datasource (Optional) |
Datasource to store the output raster dataset. | Datasource |
| Output Raster Name (Optional) |
Name of the output raster dataset. Defaults to result_ZonalStatisticsGrid. If left empty, the raster dataset will not be saved. At least one of raster or table name must be specified. |
String |
| Attribute Table Datasource (Optional) |
Datasource to store the output statistics table. | Datasource |
| Output Table Name (Optional) |
Name of the statistics table. Defaults to result_ZonalStatisticsTable. If left empty, the table will not be saved. |
String |
Output Results
| Parameter | Description | Type |
|---|---|---|
| Raster Dataset | Output zonal statistics raster dataset where all cells in the same zone share identical statistical values. | DatasetGrid |
| Table | Statistical result attribute table containing all statistical mode results and pixel counts (PixelCount) per zone. | DatasetVector |
Application Examples
Regional Statistics has wide applications across domains, such as:
- Calculating average population density within pollution zones
- Identifying vegetation types at specific elevation ranges
- Analyzing land use patterns within slope categories
The example below demonstrates calculating average elevation across different slope categories. Inputs include:
- Slope classification raster as Zonal Data
- Elevation raster as Value Data
- Statistical mode: Mean
The output raster is shown below: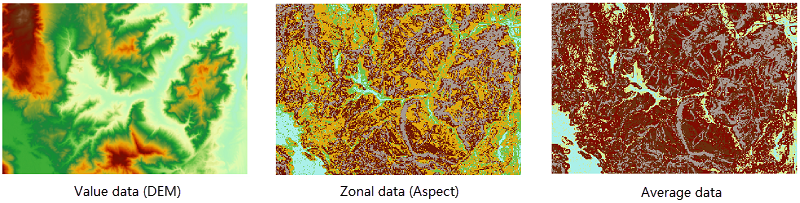
Notes
- Polygons sharing the same identifier field value are treated as a single zone. These will merge into one record in the result attribute table and share identical values in the output raster.
- Overlapping polygons in vector zonal data will be rasterized. During this process, overlapping areas will adopt the attribute of the last polygon in the dataset.
- Feature Change: Starting from SuperMap 2025, the tool no longer supports calculating Minority, Majority, and Variety statistics for raster data with floating-point pixel format. Additionally, the logic for the following three statistical methods has been optimized:
- Median: Uses approximate computation for massive floating-point numbers (e.g., test3, test6). When the number of unique values in a zone exceeds 1 million, a warning log is output: "The Minority, Majority, Median, and Variety statistics for the zone may be approximate results.";
- Minority: Returns the minimum value among those with the lowest frequency;
- Majority: Returns the minimum value among those with the highest frequency.