



Feature Description
Neighborhood statistics counts the pixels in the neighborhood of each pixel value in the dataset. That is, taking the raster to be calculated as the center, it expands a certain range around it, and statistical calculations are performed based on the raster data within these neighborhood ranges, with the operation result assigned as the pixel value. The statistical methods currently provided include: Maximum, Minimum, Majority, Minority, etc. Commonly used neighborhood range types include: Rectangle, Circle, Annulus, and Wedge.
The following figure is a schematic diagram of neighborhood statistics. The cell located in the second row and third column has its value determined by all pixel values within a 3*3 (rectangular neighborhood) area obtained by expanding around it.
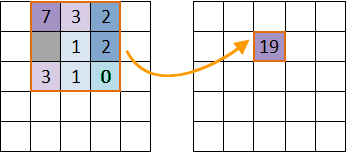
SuperMap neighborhood statistics provides 10 statistical models, as follows:
- Minimum: Finds the minimum value of raster cell values within the area.
- Maximum: Finds the maximum value of raster cell values within the area.
- Mean: Calculates the average value of all raster cell values within the area.
- Standard Deviation: Calculates the standard deviation of all raster cell values within the area.
- Sum: Calculates the sum of raster cell values within the area.
- Variety: Counts the number of distinct raster cell values that appear within the area.
- Range: Calculates the range of raster cell values within the area, i.e., the maximum value minus the minimum value within the area.
- Majority: The value with the highest frequency among raster cell values within the statistical area.
- Minority: The value with the lowest frequency among raster cell values within the statistical area.
- Median: The middle value when all raster cell values within the area are sorted in ascending order.
Parameter Description
| Parameter Name | Default Value | Parameter Interpretation | Parameter Type |
|---|---|---|---|
| Source Raster Data | Source raster data. | DatasetGrid | |
| Target Datasource | The datasource where the specified resulting dataset is stored. | Datasource | |
| Result Dataset Name | The specified resulting dataset name. | String | |
| Neighborhood Type | Rectangle | Selects the shape for neighborhood statistics. Currently supports 4 neighborhood shapes, including Rectangle, Circle, Annulus, and Wedge. After selecting the shape to use, the specific shape size must also be set. For example, for a rectangle, its width and height need to be set; for a wedge, its radius, start angle, and end angle need to be set. | NeighbourShapeType |
| Unit Type of Focal Statistics | Grid Coordinates | Selects the unit type used for statistics. Currently supports 2 unit types, including Grid Coordinates (CELL) and GCS (MAP). Grid Coordinates means using the number of grid rows and columns as the neighborhood unit; GCS means using the map unit as the neighborhood unit. | NeighbourUnitType |
| Statistical Methods of Neighborhood Analysis | Minimum | Selects the statistical model to use. There are 10 types to choose from, including Minimum, Maximum, Mean, Standard Deviation, Sum, Variety, Range, Majority, Minority, and Median. | GridStatisticsMode |
| Ignore NoData | False | When Ignore NoData is selected, statistics are only performed on cells with values in the raster data during calculation; otherwise, NoData cells are also included in the statistics. | Boolean |
| Inner Radius (Optional) |
0.0 | The inner radius of the annulus neighborhood. This parameter can be set when the neighborhood type is Annulus. | Double |
| Outer Radius (Optional) |
0.0 | The outer radius of the annulus neighborhood. This parameter can be set when the neighborhood type is Annulus. | Double |
| Width (Optional) |
0.0 | The width/number of columns of the rectangle. This parameter can be set when the neighborhood type is Rectangle. | Double |
| Height (Optional) |
0.0 | The height/number of rows of the rectangle. This parameter can be set when the neighborhood type is Rectangle. | Double |
| Radius (Optional) |
0.0 | The radius of the circle. This parameter can be set when the neighborhood type is Circle or Wedge. | Double |
| Start Angle (Optional) |
0.0 | The start angle of the wedge neighborhood. This parameter can be set when the neighborhood type is Wedge. | Double |
| End Angle (Optional) |
0.0 | The end angle of the wedge neighborhood. This parameter can be set when the neighborhood type is Wedge. | Double |
Output Result
| Parameter Name | Parameter Interpretation | Parameter Type |
|---|---|---|
| Result Raster Dataset | Result raster dataset. | DatasetGrid |