


Feature Description
Overlay analysis, as a key spatial analysis function in the GIS field, is based on a unified spatial reference system. By performing a series of set operations on two datasets, it generates a new dataset containing geometry information and attributes.
Distributed vector overlay analysis provides the following two tools, suitable for different computational needs:
1. Overlay Analysis
- Supports inputting vector data from multiple sources by connecting the Read Vector Data tool, such as GDB, ShapeFile, PostGIS, Oracle, etc.;
2. DSF Stacking Analysis
- Only supports inputting datasets read from the SuperMap DSF data source, typically obtained by connecting the Read the DSF Directory tool to get input data.
- DSF is a vector data storage method optimized for distributed computing, which can significantly improve computational performance for large-scale data, suitable for overlay analysis of massive vector data at the tens of millions level and above.
Overlay Type
Distributed vector overlay analysis supports multiple types of operations:
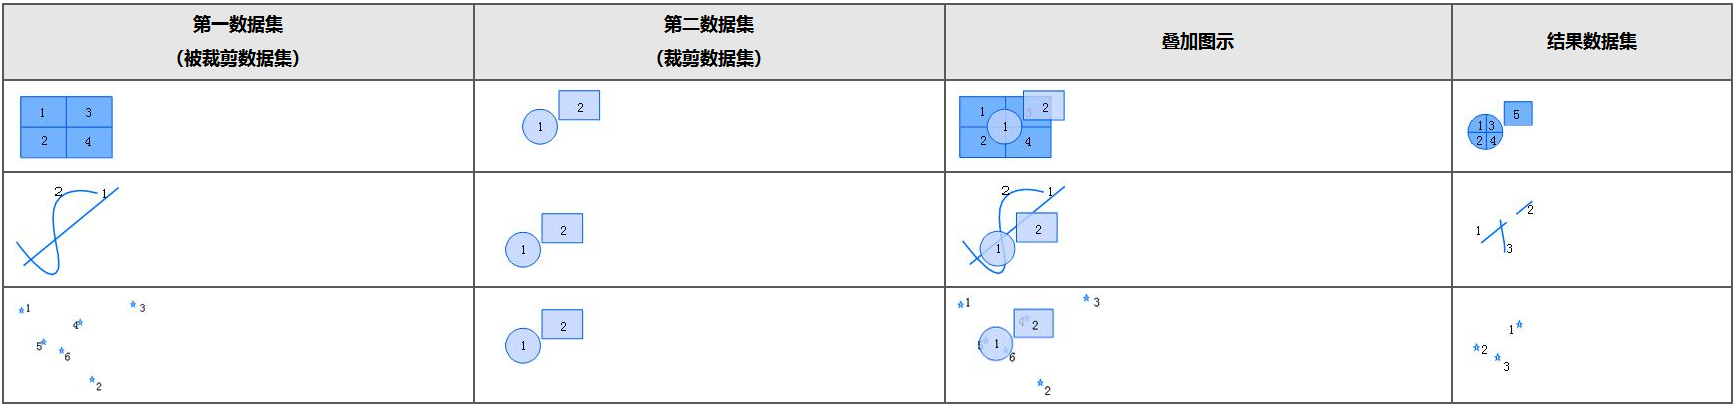
- Clip: Extracts the part of the source dataset covered by the overlay dataset and writes it to the result dataset. The result dataset retains the attributes of the source dataset, but attribute values such as area, perimeter, and length will be updated.
Notes:
Since SuperMap 11i (2024), the clip algorithm has been optimized. The optimized "clip operation" differs from the "intersect operation" in the spatial geometry information of the result dataset. The clip operation trims the source data along the edges of the overlay data, effectively avoiding the segmentation of source data by internal geometries of the overlay data, thereby preserving the geometric integrity of the source data to the greatest extent.

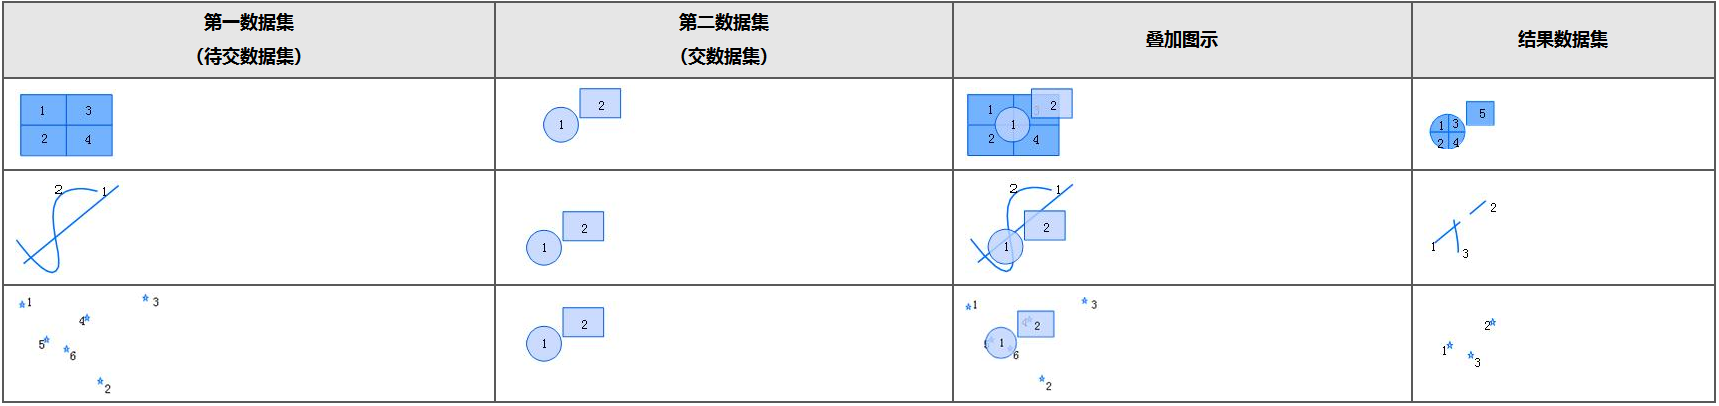
- Intersect: Extracts the intersecting part between the source dataset and the overlay dataset and writes it to the result dataset.
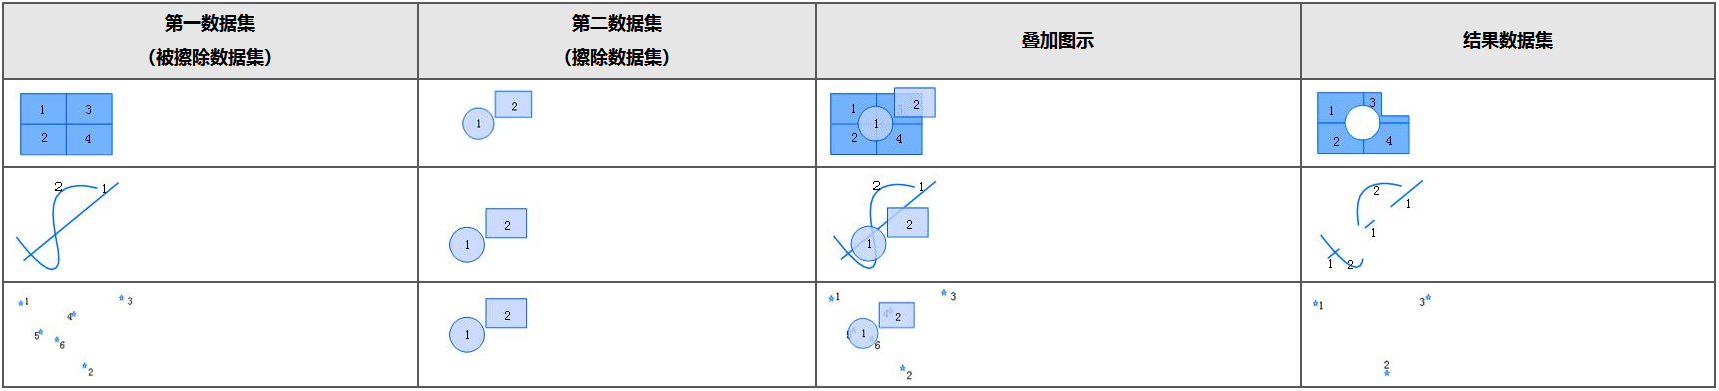
- Erase: Opposite to the clip operation, the overlay dataset defines the erase area. Objects within the erase area in the source dataset will be deleted, while objects outside the erase area will be retained.
- Identity: The identity operation results in a layer range identical to that of the source data, but includes geometric shapes and attribute data from the overlay dataset.
- Update: Replaces the overlapping part of the source dataset with the overlay dataset. The result dataset retains the geometry information and attributes of the update dataset.

- Intersection Negation: For each polygon object in the source dataset, removes the part that intersects with the geometry in the overlay dataset, retaining the non-intersecting parts.

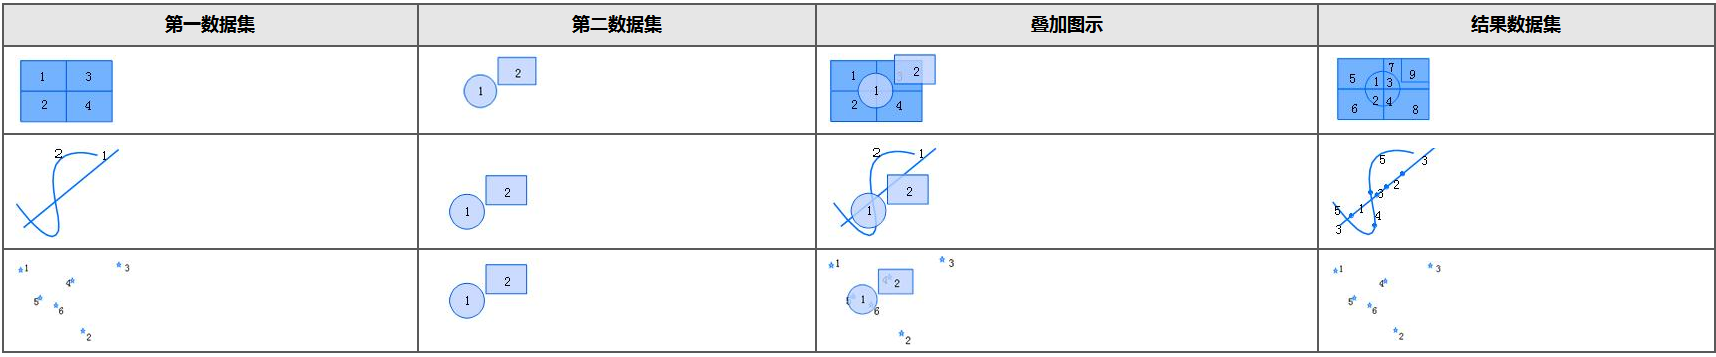
- Union: After performing a union operation, polygons at the intersection of the two region datasets are split, and the geometric shapes and attributes of both datasets are output to the result dataset.

Fuzzy
During overlay analysis, setting the fuzzy tolerance is crucial for ensuring the correctness of results. The fuzzy tolerance determines the tolerance for node snapping, meaning that when the distance between two points in the data is less than the fuzzy value, they are considered the same node and merged; when the distance is greater than the fuzzy value, the nodes remain unchanged. Therefore, the higher the precision of data creation, the smaller the fuzzy value needed. However, an overly small fuzzy value increases the time required for overlay analysis. Thus, in practical applications, an appropriate fuzzy value should be set as needed.
To enhance tool usability, the distributed overlay analysis tool provides different default tolerance values for data in different coordinate systems, ensuring lossless data and efficient computation in most cases.
- When the dataset coordinate system is a geographic coordinate system, the default fuzzy value is 1.0e-8;
- When the dataset coordinate system is empty or a projected coordinate system, the default fuzzy value is 1.0e-3.
Parameter Description
| Parameter Name | Parameter Interpretation | Parameter Type |
|---|---|---|
| Source Data | Input the source data to be overlaid, supporting point, line, and region datasets | FeatureRDD |
| Overlay Dataset | Input the dataset used for overlay, only supporting region dataset | FeatureRDD |
| Field Collection to be Saved in the Overlaid Source Data (Optional) |
The field collection to be saved in the overlaid source data. If the source data and overlay data have fields with the same name, the field from the source data in the result dataset will be named "FieldName_1", and the field from the overlay data will be named "FieldName_2" | String |
| Field Collection to be Saved in the Overlay Dataset (Optional) |
The field collection to be saved in the overlay dataset. If the source data and overlay data have fields with the same name, the field from the source data in the result dataset will be named "FieldName_1", and the field from the overlay data will be named "FieldName_2". Note that the clip, erase, and update modes do not require setting this parameter. | String |
| Overlay Analysis Type of Operation | Select the overlay analysis type of operation. Note that different types of operations support different source data types: 1. For clip, intersect, erase, and identity operations, the source data supports point, line, or region datasets. 2. For update, intersection negation, and union operations, the source data only supports region datasets |
JavaSpatialOperatorType |
| Fuzzy (Optional) |
The default value is 0.0, which means that when the dataset coordinate system is a geographic coordinate system, a fuzzy value of 1.0e-8 is used. When the coordinate system is empty or a projected coordinate system, a fuzzy value of 1.0e-3 is used. The tolerance is used to determine the relationship between points and points, and between points and lines. When points are within the tolerance, they will merge into one point; when the distance between a point and a line is within the tolerance, the line will be split by the point. |
Double |
| Keep Overlaps of Source Data (Optional) |
Selected by default. Note that this option only takes effect for identity operations. If the source data is a line and the line is within multiple polygon objects (with overlapping polygons), checking this parameter returns one object; otherwise, multiple objects are returned. If the source data is a polygon, when both the source data and overlay data have complex topologies (e.g., both have polygon overlaps), checking this parameter outputs based on the overlap relationships of the source data. For example, if both the source data and overlay data have two layers of overlap, not checking results in four layers of overlap in the output result, while checking maintains the two layers of overlap from the source data. |
Boolean |
Output Result
| Parameter Name | Parameter Interpretation | Parameter Type |
|---|---|---|
| Overlay Analysis Result Dataset | The calculation result of the distributed analysis tool is stored in memory. It needs to be written to a database or local storage by connecting the Save Vector Data tool. | FeatureRDD |
Application Example
Overlay analysis, as a very important spatial analysis function, is widely used in fields such as natural resource management, urban construction evaluation, and territorial spatial planning. For example, using overlay analysis to assess the distribution and utilization of soil resources within a specific administrative region involves the following steps:
Step 1: Data Preparation
Prepare national land use data and administrative division polygon data for the target region, ensuring both datasets have the same coordinate system.
Step 2: Build a Model for Overlay Analysis
1. Input Data: Input the national land use data and administrative division polygon data through the Read Vector Data tool, and connect them as "Source Data" and "Overlay Data" to the input parameters of the Overlay Analysis tool;
2. Parameter Configuration: In the Overlay Analysis tool parameters, select "Intersect" as the type of operation, which means generating a new dataset containing the intersecting areas of the source data and overlay dataset, retaining all attributes from both datasets. Since the data uses a geographic coordinate system, the default fuzzy value of 1.0e-8 is sufficient to ensure the accuracy of the calculation result, and no adjustment of the tolerance is needed;
3. Result Saving: Save the overlay analysis result to a specified database or local folder by connecting the Save Vector Data tool. After the model execution is completed, the overlay analysis result data can be viewed.
Notes
1. Field Case Conversion
When using this tool, note that all uppercase fields in the input data are automatically converted to lowercase and reflected in the output result data. Therefore, if you find unexpected results during data processing, it may be due to field case conversion. Please check your input data and analysis result to confirm field case consistency.
2. Function Changes
Since SuperMap 2025 (12.0.1), overlay analysis for data with different coordinate systems is supported. Currently, setting coordinate system transformation parameters is not supported. When the source data and target dataset are based on different ellipsoids (e.g., transforming from the Beijing_1954 coordinate system based on the Krasovsky_1940 ellipsoid to a coordinate system based on the WGS_1984 ellipsoid), the transformation result may be inaccurate, causing offsets between layers.
Since SuperMap 2025 (12.0.1), the overlay analysis tool has undergone algorithm upgrades, mainly including the following aspects:
The new algorithm has stronger geometric error tolerance and can directly handle geometric errors in the input data, including: dangling lines, zero-length segments, coincident points and collinearity, inconsistent point order directions, and self-intersection issues.
By setting tolerance, calculation errors can be controlled more precisely, effectively avoiding errors caused by improper tolerance configuration or data quality issues, significantly improving algorithm stability and output result accuracy.
To enable the new algorithm, modify the corresponding configuration items in the following configuration files:
In the configuration file at [iDesktopX Product Directory]\bin\SuperMap.xml, set IsUseNewAnalysisAlgorithm to "TRUE".
In the configuration file at [iServer Product Directory]\support\objectsjava\bin\SuperMap.xml, set IsUseNewAnalysisAlgorithm to "TRUE".