


Regional Statistics
Feature Description
Regional statistics involves performing statistical operations (currently supporting maximum, minimum, sum, and average) on each cell within a specified zone. In the regional statistics for raster data, two datasets are involved in the calculation: one representing value data (raster data) and the other representing zonal data (vector surface data). The result data is a vector surface dataset.
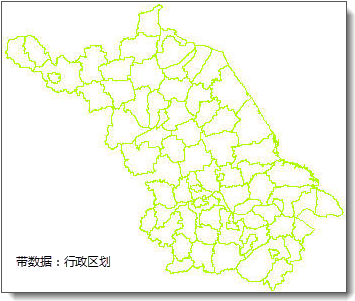
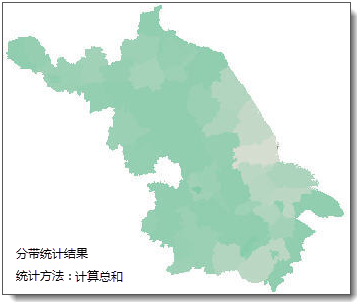
As shown in the figure below, from left to right are the cultivated land area raster data of a province, the county administrative boundary data, and the regional count result. The sum method is used for statistics, resulting in the total cultivated land area within each county administrative region.

Parameter Description
【Raster Regional Statistics】Tool:
| Parameter Name | Default Value | Parameter Interpretation | Parameter Type |
|---|---|---|---|
| Raster RDD to be Calculated | Raster RDD to be Calculated | RasterRDD | |
| Area Dataset - Input Connection Info | Connection info for the area dataset, which is the FeatureRDD for the region (requires connecting the read vector data tool before use). | FeatureRDD | |
| Statistical Model | Statistical Model, currently supporting only maximum, minimum, sum, and average. | JavaRasterStatisticsMode | |
| Zone Surface ID Field (Optional) | Field in the area dataset used to identify zones. If not set, the FeatureID is used, requiring the FeatureRDD to contain a FeatureID. | String | |
| Treat Pixels as Surface Objects (Optional) | false | Check this option to treat pixels as surface objects, ensuring that every pixel intersecting the zone surface is counted. Otherwise, pixels are treated as point objects, and those whose center is not inside the zonal data are excluded from calculation. | Boolean |