


Instructions
Perform sector neighborhood statistics on grid pixels, store the statistical results as new values at the pixel location, and generate a new raster dataset (RasterRDD). Fan neighborhood statistics is the process of counting the pixels within the fan neighborhood range of each pixel value in a dataset. This involves taking the grid to be calculated as the center and extending a certain range around it. Based on the grid data within this fan neighborhood range, statistical calculations are performed, and the calculation results are used as pixel values. The current statistical methods provided include: maximum, minimum, median, mean, standard deviation, etc.
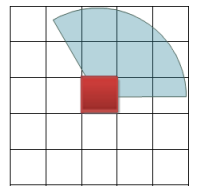
扇形邻域
The size of the sector neighborhood is determined based on the specified circle radius, starting angle, and ending angle. All pixels within the sector participate in neighborhood processing. The shape of the fan-shaped neighborhood is shown in the following figure, and the cells in the figure are only indicative.
Parameter Specification
| Parameter Name | Default Value | Parameter Definition | Parameter Type |
|---|---|---|---|
| RDD to be counted | RasterRDD to be counted | RasterRDD | |
| Neighborhood radius | 0.0 | Neighborhood radius, in units of lattice numbers. If the distance between the neighborhood lattice and the center is exactly equal to radius, it will be assigned to the neighborhood | Double |
| Starting angle | 0.0 | The starting angle of the sector neighborhood, in degrees | Double |
| Termination angle | 0.0 | The termination angle of the sector neighborhood, in degrees | Double |
| Statistical mode | Total | Statistical mode. Optional values: total, maximum, minimum, median, standard deviation, average | JavaRasterStatisticsMode |