


Feature Description
After raster data undergoes geometric transformations such as registration, correction, or projection, the center positions of the cells often change, causing the cells of the raster to be misaligned. Therefore, it is necessary to resample the raster data according to certain rules to establish a new raster matrix. Raster resampling is the process of assigning the cell values or derived values from the input image to each cell in the output image. The returned result type is a raster dataset (RasterRDD).
Furthermore, raster resampling is a common data processing method in spatial analysis for handling raster resolution matching issues. To facilitate analysis, different resolutions are often converted to the same resolution through raster resampling. For a given raster data with a specific spatial resolution, it can be resampled into larger cells through a resampling operation, i.e., reducing the spatial resolution. This process loses some of the original high spatial resolution details; it can also be resampled into smaller cells, but this does not add more information. Resampling a multispectral remote sensing image with low spatial resolution to the same resolution as a panchromatic image with high spatial resolution, and then fusing the two images, results in an image that contains both high spectral and high spatial resolution information. This is a common remote sensing data fusion method used for thematic extraction and application.
Resampling is an operation that changes the resolution of a raster dataset. Based on the change in resolution, it can be divided into upsampling and downsampling. Upsampling means the cell edge length becomes smaller and the number of cells increases; downsampling means the cell edge length becomes larger and the number of cells decreases. The SuperMap distributed resampling tools mainly include six methods: nearest, bilinear, cubic convolution interpolation, cubic spline interpolation, Lanczos, and average. They can be categorized into two types:
- Aggregation: Based on the target resolution size, expand half a cell to the left and right, then calculate the starting row and column numbers for the top, bottom, left, and right, and then calculate raster statistics. The aggregation-type resampling method is average.
- Point-based: Obtain values around the point based on Euclidean distance for calculation. The point-based resampling methods include nearest, bilinear, cubic convolution interpolation, cubic spline interpolation, and Lanczos.
Nearest
Nearest assigns the value of the nearest cell in the input raster dataset as the input value to the corresponding cell in the output raster dataset.
The advantage of this method is that it does not change the original raster values, and the processing speed is fast. However, this method may cause a displacement of half a pixel size. It is suitable for discrete data representing classifications or specific themes, such as land use, vegetation types, etc.
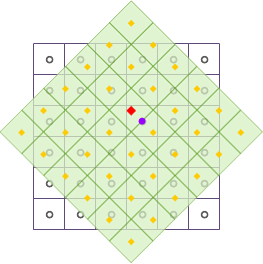
As shown in the figure above, after raster data undergoes geometric transformations such as translation and rotation, the output raster dataset is resampled using the nearest method. The black wireframe represents the input raster dataset, the light green fill represents the output raster dataset, and the red square point represents the center position of a specific cell in the output raster dataset, whose cell value will be updated. Find the center point of the cell closest to the cell where the red square point is located, i.e., the purple circle shown in the figure, and fill the cell value represented by the purple circle into the red square point, completing the resampling of one raster cell.
Bilinear
The bilinear interpolation method is based on the cubic linear interpolation method. It calculates a new cell value by taking the weighted mean of the cell values of the four nearest neighboring cells (4-neighborhood) in the input raster dataset and assigns it to the corresponding cell in the output raster dataset. The weights are determined by the distance between the center of each cell in the 4-neighborhood and the interpolation point.
The resample result of this method will be smoother than nearest, but it will change the original raster values. It is suitable for continuous data representing the distribution of certain phenomena or terrain surfaces, such as DEM, temperature or rainfall distribution, slope, etc. These data are originally continuous surfaces obtained through interpolation of sample points.
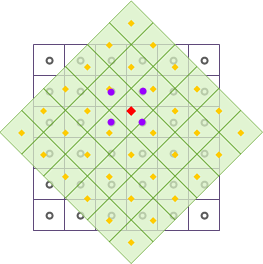
As shown in the figure above, after raster data undergoes geometric transformations such as translation and rotation, the output raster dataset is resampled using bilinear. The black wireframe represents the input raster dataset, the light green fill represents the output raster dataset, and the red square point represents the center position of a specific cell in the output raster dataset, whose cell value will be updated. Take the four neighboring points around the red square point; the center points of these four neighboring points are indicated by the purple circles in the figure. By calculating their distance-weighted mean, the calculation result is filled into the red square point, completing the resampling of one raster cell.
Cubic
Similar to bilinear, cubic is based on a quintic polynomial interpolation method. It calculates a new cell value by taking the weighted mean of the cell values of the 16 nearest neighboring cells (16-neighborhood) in the input raster dataset and assigns it to the corresponding cell in the output raster dataset. The weights are determined by the distance between the center point of each cell in the 16-neighborhood and the interpolation point.
Cubic improves interpolation accuracy by increasing neighboring points to obtain the optimal interpolation function. The algorithm is relatively complex, with significant computational load and longer processing time. Since this method uses a 16-neighborhood for weighted calculation, the processing result will be clearer, and the boundaries of the raster data will have a sharpening effect. This method also changes the original raster values and may exceed the value range of the input raster. It is suitable for resampling aerial photographs and remote sensing imagery.
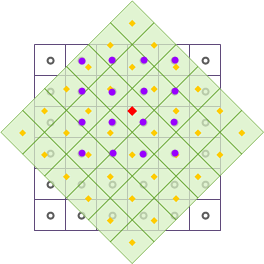
As shown in the figure above, after raster data undergoes geometric transformations such as translation and rotation, the output raster dataset is resampled using cubic. The black wireframe represents the input raster dataset, the light green fill represents the output raster dataset, and the red square point represents the center position of a specific cell in the output raster dataset, whose cell value will be updated. Take the 16 neighboring points around the red square point; the center points of these 16 neighboring points are indicated by the purple circles in the figure. By calculating their distance-weighted mean, the calculation result is filled into the red square point, completing the resampling of one raster cell.
Cubic Spline Interpolation Method
The cubic spline interpolation method is based on the Akima interpolation algorithm. The Akima interpolation method stipulates that interpolation between two measured points requires not only these two measured values but also the observed values at four adjacent measured points near these two points. In other words, using the cubic spline interpolation method to resample cell values in the input raster dataset requires considering six cell values in total. This algorithm considers the effect of factor derivatives, so the resulting interpolation curve is smooth and natural, avoiding unnatural oscillations in the generated curve.
Lanczos Method
The Lanczos method is an algorithm that transforms a symmetric matrix into a symmetric tridiagonal matrix through orthogonal similarity transformation. It selects a rectangular region in the input raster dataset and calculates weights to obtain new cell values. Due to its trend of contrast enhancement, Lanczos resampling is often referred to as a "sharpening filter." On one hand, Lanczos resampling can improve the ability to detect edges and linear features; on the other hand, the output raster dataset may lose some spatial accuracy.
Average
Uses a group of cells from the source raster data to calculate the average value as the resulting cell value, which is jointly determined by the values of the original raster it contains. Using average can generalize raster data to achieve the purpose of removing unwanted information or eliminating minor errors.
From the above, bilinear interpolation and cubic are not suitable for discrete classified data because both methods change the original raster values; nearest, bilinear, and cubic resampling methods are all suitable for continuous data, differing only in computation time and processing results… Before resampling a large amount of raster data, it is recommended to first select a portion of the data for experimentation, using different methods for resampling to evaluate which method yields higher accuracy, thereby selecting the optimal resampling method for the entire dataset.
Parameter Description
| Parameter Name | Default Value | Parameter Interpretation | Parameter Type |
|---|---|---|---|
| RDD to Analyze | The RasterRDD that needs to be resampled. | RasterRDD | |
| Cell Size | 0.0 | The desired cell size after resampling. | Double |
| Resampling Method | The resampling method. Includes nearest, bilinear, cubic, cubic spline interpolation, Lanczos, average. | JavaResampleMethod |