


Feature Description
Image standard deviation enhances the contrast of an image by trimming the extreme values and then performing linear extrusion on other pixel values. Statistics are performed on the data of the original image, mainly to obtain the range of one standard deviation. Then, based on the standard deviation coefficient, the standard deviation range is updated. The values within the finally calculated standard deviation range are linearly extruded to distribute between [0,255]. After stretching, the deviation of pixel display values from the mean decreases. The returned result type is a raster dataset (RasterRDD).
Standard deviation: The arithmetic square root of variance, reflecting the degree of dispersion among individuals within a group. Simply put, it indicates the deviation of most values in the group from the mean. A larger standard deviation means that most values deviate more from the mean. A smaller standard deviation means that most values are closer to the mean.
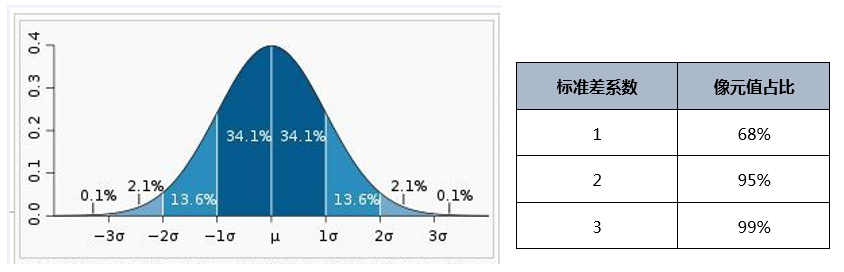
As shown in the figure below, the pixel value proportion for one standard deviation coefficient is 68%, for two standard deviation coefficients is 95%, and for three standard deviations coefficients is 99%. When the standard deviation coefficient is defined as 2, pixel values exceeding two standard deviations are pushed to 0 or 255. Pixel values within two standard deviations are linearly extruded to 0-255. Standard deviation is often used to brighten raster datasets with darker tones.
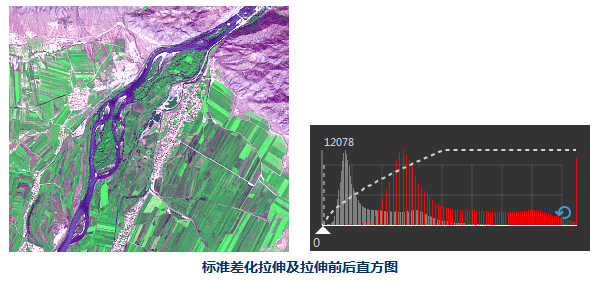
The standard deviation stretch method is vividly described through histograms below. As shown in the figure, the left image shows the effect after applying standard deviation, and the right image shows a comparison of histograms before and after stretching. It can be seen that after stretching, the histogram shape of the image conforms to a normal distribution curve, and the standard deviation of the histogram for the stretched image increases, meaning the deviation of pixel display values from the mean in the image data decreases.
Standard deviation is often used to brighten images with darker tones.
Parameter Description
| Parameter Name | Default Value | Parameter Interpretation | Parameter Type |
|---|---|---|---|
| RDD to be Analyzed | RDD to be analyzed. | RasterRDD | |
| Standard Deviation Coefficient (Optional) |
2.0 | Standard deviation coefficient, default is 2.0. Pixel values exceeding this standard deviation are pushed to the maximum or minimum target pixel values. Other data use the mean plus or minus this standard deviation as the original extreme values for linear extrusion. | Double |
| Perform Statistics Within Function (Optional) |
true | Whether to perform statistics within the function, default is true, meaning full statistics are performed on the input raster dataset within the function. False means statistical data is passed in externally. | Boolean |
| Standard Deviation per Band (Optional) |
Standard deviation for each band of the dataset, array length equals the number of bands. Effective only when 【Perform Statistics Within Function】 is not checked. This value can be an empirical value for certain data types, calculated from basic statistics or histograms, or directly obtained from statistical values saved in data information. | Object | |
| Mean per Band (Optional) |
Mean for each band of the dataset, array length equals the number of bands. Effective only when 【Perform Statistics Within Function】 is not checked. This value can be an empirical value for certain data types, calculated from basic statistics or histograms, or directly obtained from statistical values saved in data information. | Object | |
| Minimum per Band (Optional) |
Minimum for each band of the dataset, array length equals the number of bands. Effective only when 【Perform Statistics Within Function】 is not checked. This value can be an empirical value for certain data types, calculated from basic statistics or histograms, or directly obtained from statistical values saved in data information. | Object | |
| Maximum per Band (Optional) |
Maximum for each band of the dataset, array length equals the number of bands. Effective only when 【Perform Statistics Within Function】 is not checked. This value can be an empirical value for certain data types, calculated from basic statistics or histograms, or directly obtained from statistical values saved in data information. | Object | |
| Minimum Target Pixel Value (Optional) |
0 | Minimum target pixel value, original pixel values are stretched between the minimum and maximum target pixel values. Default is 0. | Integer |
| Maximum Target Pixel Value (Optional) |
255 | Maximum target pixel value, original pixel values are stretched between the minimum and maximum target pixel values. Default is 255. | Integer |