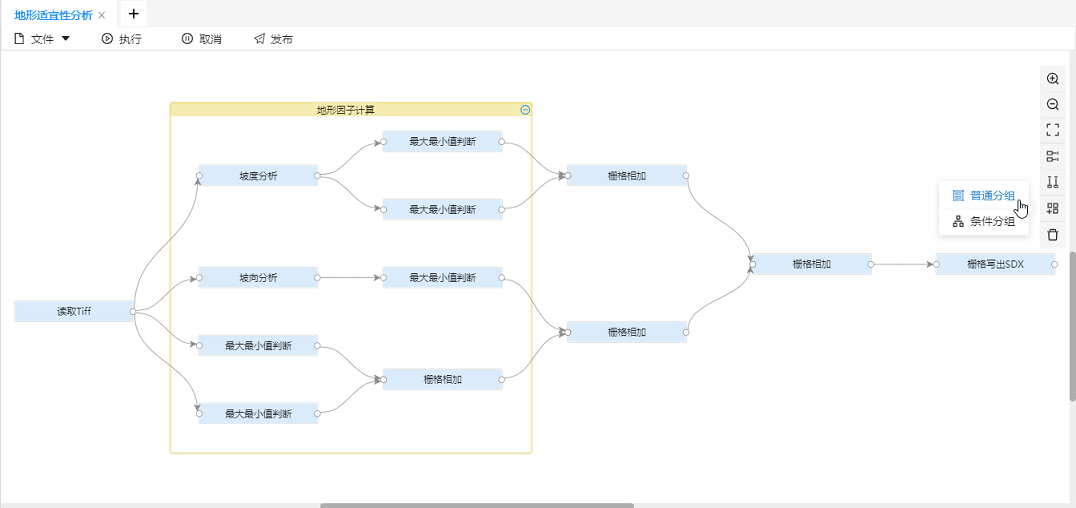
Adding grouping to the model can construct the tools in the model into logical units, making it easier to group and manage the tools in the model. The processing automation modeling page provides two modes: regular grouping and conditional grouping.
Ordinary grouping: When there are many tools in the model, adding ordinary grouping can quickly sort out business logic, while folding grouping can simplify the display of the model and increase its readability.
Conditional grouping: When different conditional filtering branches need to be merged into the same subsequent processing process in the model, adding conditional grouping can achieve process reuse and simplify the model.
Instructions
Create Group: Hold down the left mouse button, select multiple tools on the canvas, and select Create Normal Group or Conditional Group from the right-click menu.
Ungroup: Select the created group and select Ungroup from the right-click menu.
Collapse grouping: Click the collapse button in the upper right corner of the grouping to collapse the grouping and simplify the display of the model.
Renaming a group: Select Rename from the right-click menu of the group and enter the appropriate Name to provide a more intuitive understanding of the role of the group.
Scenario 1: Add a regular group to simplify the display of the model
Taking the terrain suitability analysis model as an example, this model considers the impact of factors such as elevation, slope, and aspect on land use patterns to analyze the suitability of regional land development and utilization. When sharing models, in order for others to quickly understand the model, we add groups to the model. As shown in the following figure, first select tools such as "Slope Analysis", "Slope Aspect Analysis", and "Maximum and Minimum Value Judgment", and select to add a regular group. Next, consider the functional logic within the group and rename the group name to "Terrain Factor Calculation". Finally, we will fold the added groups to obtain a simplified display model.

The terrain suitability analysis model after folding and grouping is as follows:

Scenario 2: Add conditional grouping and use it in conjunction with conditional filtering
Taking the creation of an image collection model using the manifest file as an example, since we are not sure whether the data source storing the image collection exists, we can add conditional filtering to determine that if the specified data source exists, we can directly open the data source; If the specified data source does not exist, create the data source. However, the two outputs of opening the data source and creating the data source cannot both be connected to the data source parameters of creating the tessellated dataset. At this point, by creating conditional grouping, process reuse can be achieved to avoid duplicate construction of subsequent processing processes.
As shown in the following figure, first we select "Create Storage Image Collection Data Source" and "Open Storage Image Collection Data Source", and select to add conditional grouping. Next, connect the input node of the group box to the input of "Create Storage Image Set Data Source", and connect the output of "Create Storage Image Set Data Source" to the output node of the group box, completing the same connection as "Open Storage Image Set Data Source". In addition, set the filtering criteria for the input connection line to 'data source does not exist' and 'data source exists'. Finally, connect the "Image Set Data Source Connection Information" to the input node of the group box, and connect the output node of the group box to the data source parameters of the "Create Mosaic Dataset". During execution, the corresponding branch within the condition group can be selected for execution based on the filtering criteria.

Scenario 3: Add conditional grouping and use it in conjunction with iterative loops
In the early warning and prediction of geological disasters such as floods and landslides, it is usually necessary to read and visualize precipitation observation data from multiple time periods and stations. Taking the precipitation data imported from meteorological stations in various provinces across the country as an example, the pre processed precipitation data is stored in txt and csv formats. We need to import the precipitation data in bulk and perform Kriging interpolation. Here, conditional grouping is used to import precipitation data in both txt and CSV formats, and combined with iterative loops, batch reading of the data can be achieved. Finally, unified analysis and processing can be carried out.
As shown in the following figure, use the 'Iteration File' to batch import precipitation data, then box select the 'Import. CSV' and 'Import. TXT' tools to add conditional grouping. After completing the connection, set filter conditions on the input connection lines of 【 Import. CSV 】 and 【 Import. TXT 】 respectively. Select 'String Matching' as the condition type, and fill in *. csv and *. txt for the matching expression to import precipitation data in different formats. After importing data, the default is the planar coordinate system, and you need to use [Reset Coordinate System] to set the coordinate system to WGS84. Add another numerical field, update the precipitation value to the new field, and finally perform Kruggin interpolation on the precipitation to obtain the precipitation distribution map of each province in the country.


