


Cartogram
Feature Description
Cartogram deforms geographic features based on a thematic attribute, using exaggerated visualization to highlight characteristics of the attribute. Commonly used to represent distributions such as GDP across cities or population density within regions.
Applicable to region datasets.
Feature Entry
- Maps Tab->Cartography->Cartogram.
Parameter Description
- Datasource: Specifies the datasource containing the dataset for cartogram creation.
- Dataset: Defines the dataset used for cartogram generation.
- Deformation Field: Selects the field driving cartogram deformation.
- Iterations: Controls deformation iterations. Higher values enhance exaggeration but increase processing time.
- Maximum Deformation Ratio: Limits single-iteration deformation by setting the ratio between minimum and maximum values of deformation field versus area.
Application Example
Using global birth population data as an example, cartogram visualization appears as follows:
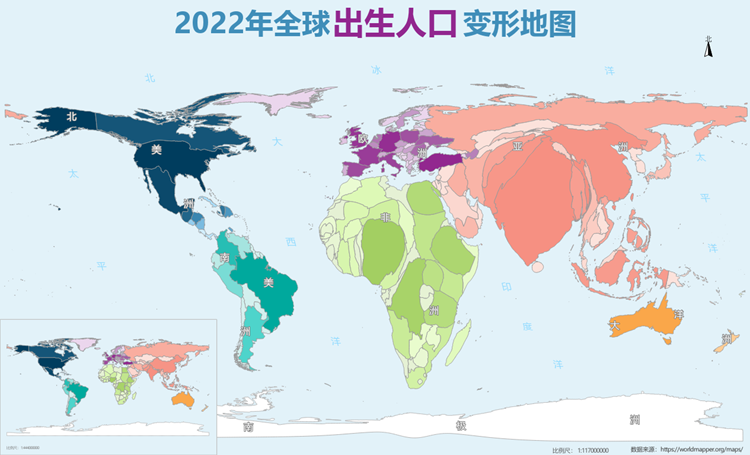
Data source: https://worldmapper.org/maps/