


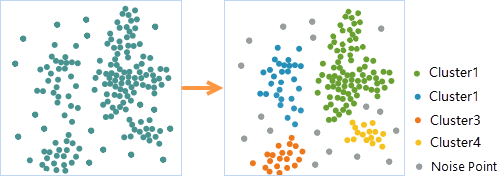
Density-based clustering divides spatially dense point distributions into clusters using specified algorithms. It provides three clustering methods: Density-Based Clustering, Hierarchical Clustering (HDBSCAN), and Ordering Clustering (OPTICS).
Definitions
- MinPts: Minimum number of points required to form a cluster.
- Clustering radius ε: Points within this radius that meet or exceed MinPts form a cluster.
- Core point: A point with at least MinPts neighboring points within ε.
- Boundary point: A point within ε of a core point but with fewer than MinPts neighbors.
- Noise point: Neither a core nor boundary point.
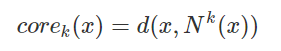
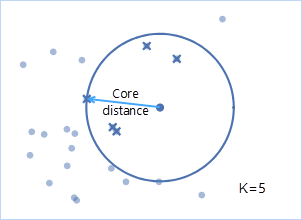
- Core distance: Distance from point X to its k-th nearest neighbor (k=MinPts), denoted as corek(x). Example when k=5:
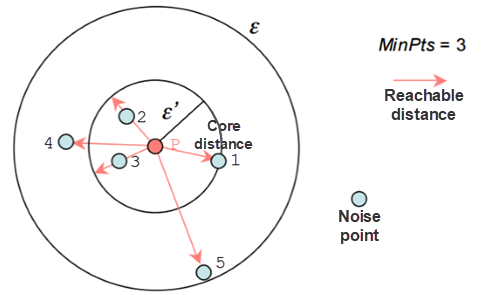
- Reachable distance: The maximum value between core distance and actual distance between two points.
Example: With minPts=3 and ε=d(P,5), core distance of Point P is d(P,1). Reachable distances: Point 2 and 3 use core distance d(1,P); Point 4 uses actual distance d(4,P).
Principles
- Density-Based Clustering (DBSCAN)
Identifies clusters via spatial density, defining clusters as maximal sets of density-connected points. Robust to noise and detects arbitrary-shaped clusters.
Algorithm: Finds core objects using Eps and MinPts, then expands clusters from these cores.

Parameter adjustment: Increasing Eps merges clusters; decreasing splits clusters. Higher MinPts increases noise detection.
Use case: Identifying accident-prone areas with explicit thresholds (e.g., 3 accidents within 2000m).
- Hierarchical Clustering (HDBSCAN)
Separates clusters from noise using variable density thresholds. Creates stable clusters through hierarchical merging.
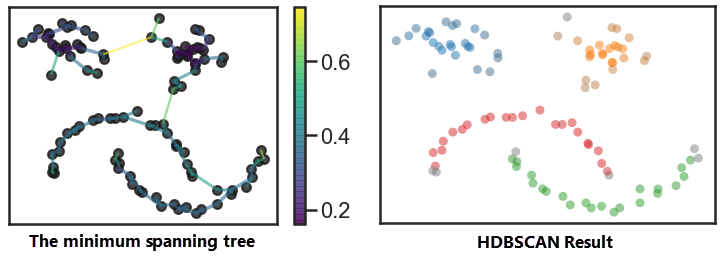
Algorithm: Improves DBSCAN by building minimum spanning trees with core/reachable distances. Splits clusters based on stability criteria.
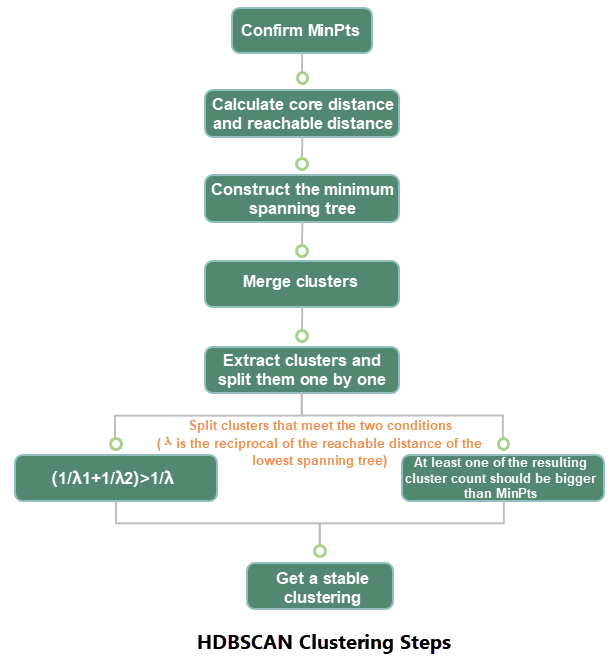
Cluster extraction conditions:
- Split clusters when 1/λ1 + 1/λ2 > 1/λ
- Stop splitting if subclusters have fewer than MinPts
- Ordering Clustering (OPTICS): Reduces parameter sensitivity by considering density connectivity. Computationally intensive but flexible in detecting variable-density clusters.
Applications
- Site selection for chain stores using customer position data
- Emergency station planning for pipe burst clusters
- Identifying high-accident road sections
- Ecological population analysis
- Anomaly detection in data cleaning/security
Feature Entry
- Spatial Statistics Tab -> Cluster Distribution -> Density-Based Clustering
- Toolbox -> Spatial Statistics -> Cluster Distribution -> Density-Based Clustering
Parameters
Parameter requirements and output fields vary by method:
| Method | DBSCAN | HDBSCAN | OPTICS |
|---|---|---|---|
| Parameters |
Clustering radius MinPts |
MinPts |
Clustering radius MinPts Compactness |
| Output Fields |
Source_ID Cluster_ID |
Source_ID Cluster_ID Prob Outlier Exemplar Stability |
Source_ID Cluster_ID ReachOrder ReachDist |
- Source Dataset: Input point dataset for analysis.
- Clustering Method:
- DBSCAN: Requires clustering radius and MinPts.
- HDBSCAN: Requires MinPts only.
- OPTICS: Requires radius, MinPts, and compactness.
- Clustering Radius:
- For DBSCAN: Defines neighborhood search range.
- For OPTICS: Maximum reachable distance threshold.
- Unit: Measurement units (default: meters).
- MinPts: Minimum points to form cluster.
- Compactness: Clustering tightness (0-100). Higher values produce denser clusters.
Output Interpretation
Results vary by method but always include Cluster_ID rendering. Key fields:
- Source_ID: Original point ID.
- Cluster_ID: Cluster membership (-1=noise).
- Prob: Cluster membership probability (1=high).
- Outlier: 1 indicates potential outlier.
- Exemplar: 1 marks representative points.
- Stability: Cluster stability score.
- ReachOrder: Processing sequence.
- ReachDist: Reachability distance for density assessment.
Case Study
Using OPTICS to analyze restaurant customer distribution identified four clusters (grey=noise). New branches should prioritize high-density cluster areas:
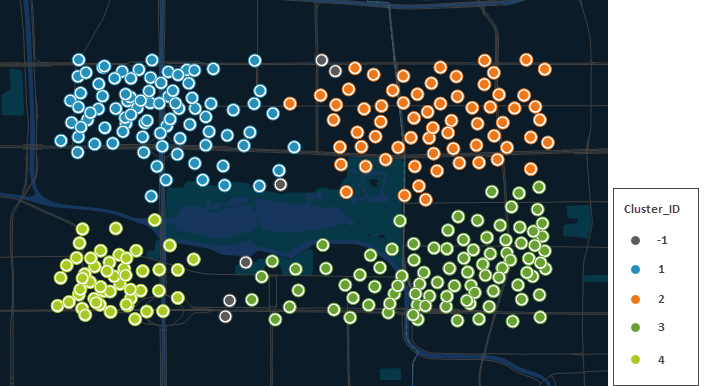
Cluster 3 has the highest proportion, indicating maximum customer density:

Related Topics
Hot Spot Analysis (Getis-Ord Gi*)