


Data description
The map Spatial Distribution of Population Density reflects the distribution of population density in 2001 in China.
| Dataset Name | Dataset Type | Data Category | Description |
| ProvinceCapital_P | Point Dataset | Administrative point | Provincial capital |
| County_P | County level administrative district | ||
| HeiHeTengChong_P | Heihe, Tengchong | ||
| Border_L | Line Dataset | Administrative boundaries | National boundaries |
| Province_L | Provincial boundaries | ||
| Coastline_L | Coastline | ||
| Country_R | Polygon Dataset | Administrative region | China |
| County_R | County region | ||
| PopDensity_R | Thematic elements | Isoregions extracted | |
| Island_R | Other region elements | Island | |
| Pop | Text Dataset | Auxiliary elements | Map name |
| PopElements | CAD Dataset | Auxiliary elements | Legend and other auxiliary elements |
Data Processing
- Interpolation analysis
The original data includes the county point data of population density property, this data is interpolated with the population density as the interpolation field. The result of interpolation analysis is obtained from all external rectangles that participate in the interpolation points, but the external rectangles of all county points can't include the whole range for creating a map, so we need copy the range of county region to generate the rectangular raster data.
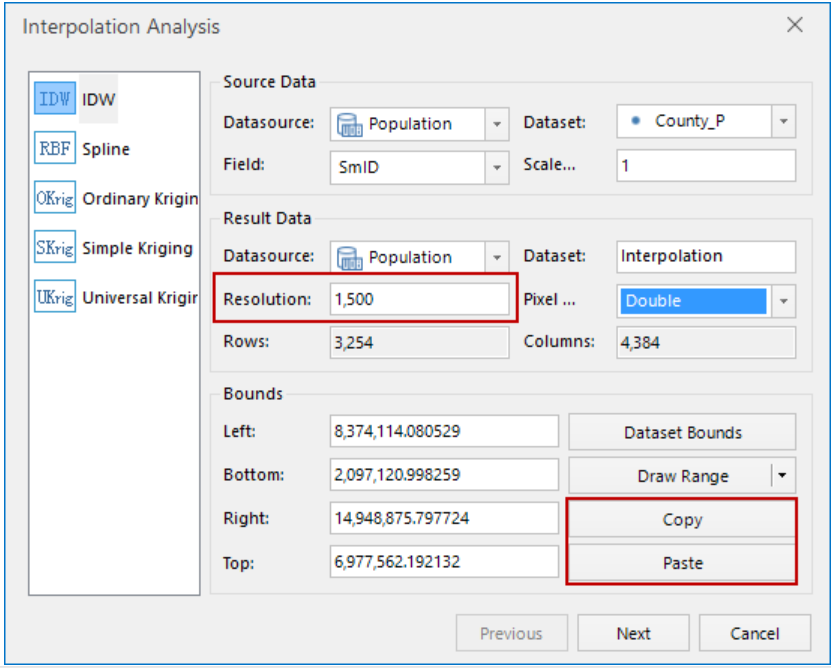
Figure: Interpolation analysis 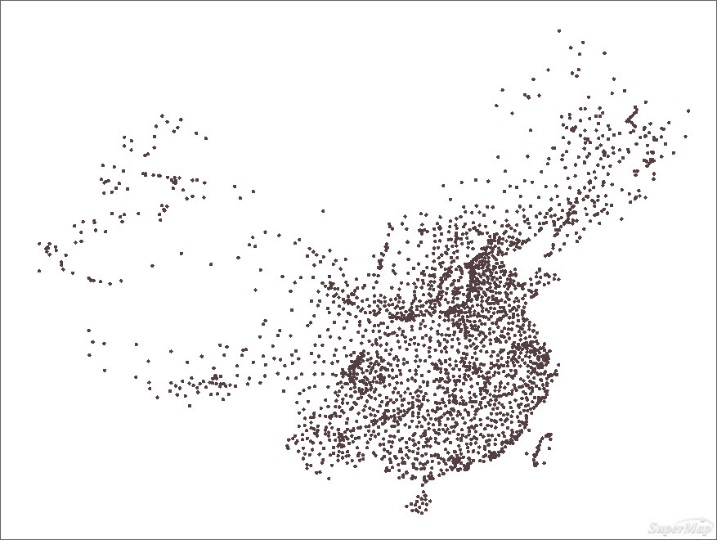
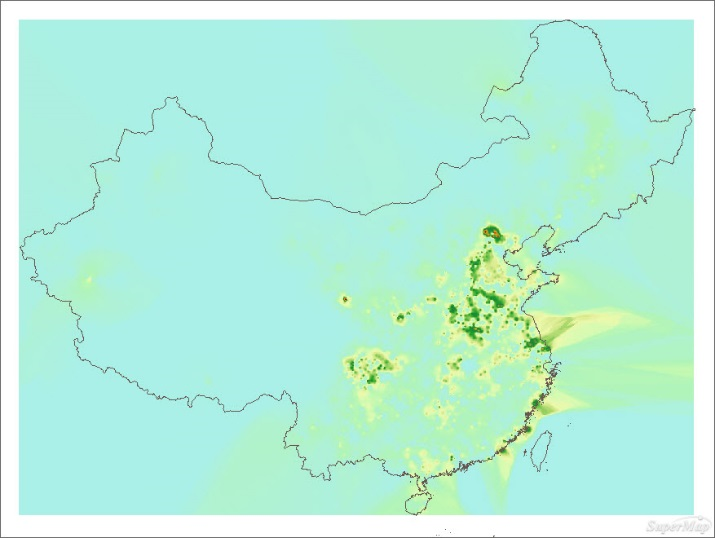
Figure: Before and after interpolation analysis - Extracting Isoregions
By the function "Extract All Isoregions" in Spatial Analysis > Raster Analysis > Surface Analysis to extract isoregions to the result of interpolation analysis and to smooth the contour. Because of the result is triangle, the extracted isosurface is triangle, it needs to be clippied.
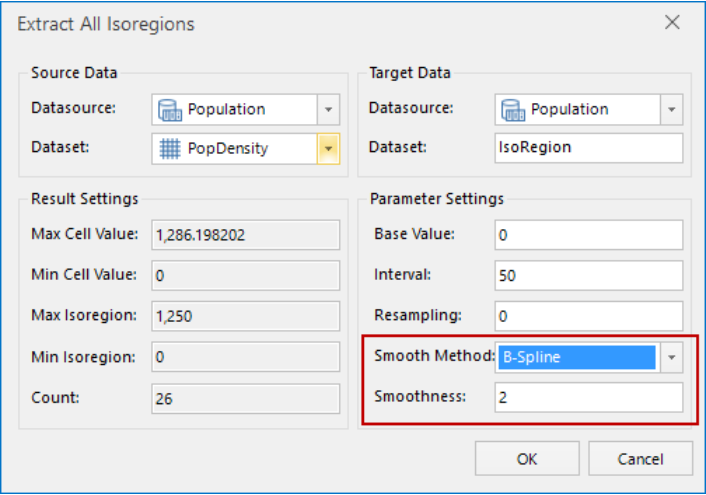
Figure: Extracting all isoregions 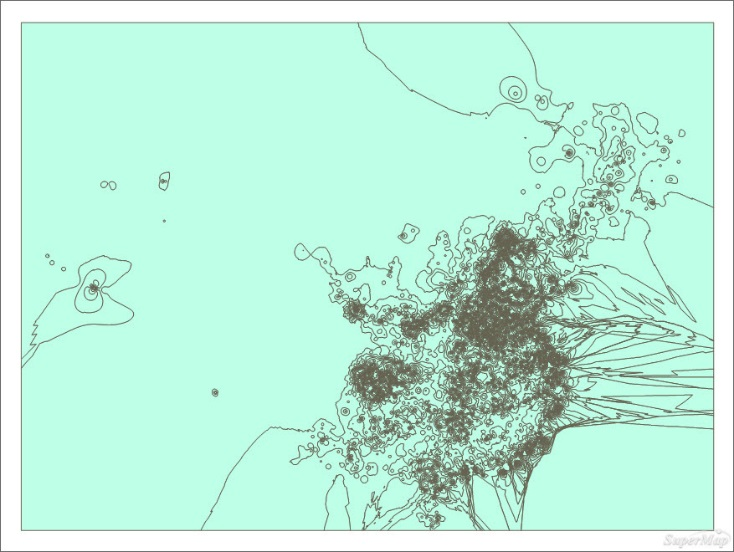
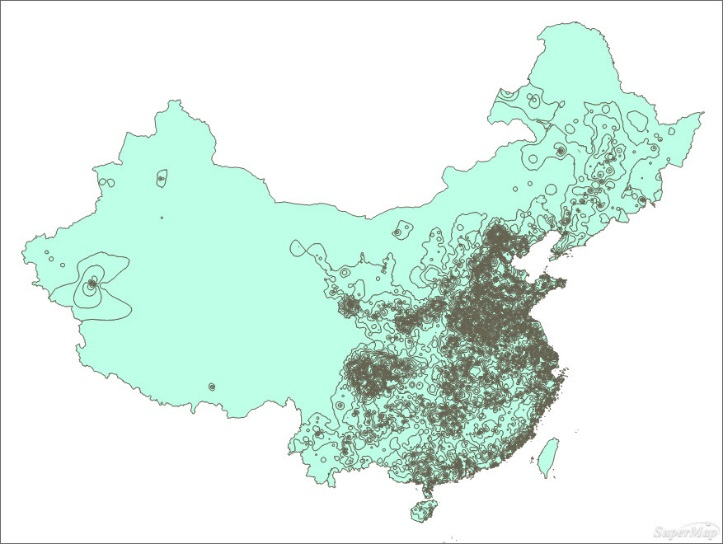
Figure: Before and after clipping the isoregion
Main Points of Cartography
- Making the interpolation analysis to the county point with population density data (recommended the resolution is set to 1500) and extracting isosurface. And then creates range thematic map for the isosurface to directly display the population distribution.
- It is made the difference in population density is more clear that adding provincial boundary and provincial city.
- Heihe-Tengchong Line (Hu Line) is proposed in 1935 by the geologist Hu Huanyong, it roughly distinguishes the disparity of population distribution between the southeast and northwest of china.
- Creating a unique thematic map for regions of China, Setting gray and a certain offset for it, then superimposed on the bottom of the base map which will made the bottom map presents a three-dimensional effect.
- Map name and legend can enhance map performance.
Mapping process
- Makinga base map with three-dimensional effect
New map window, adding the regions of China, creating a unique thematic map by SmUserID as an expression.
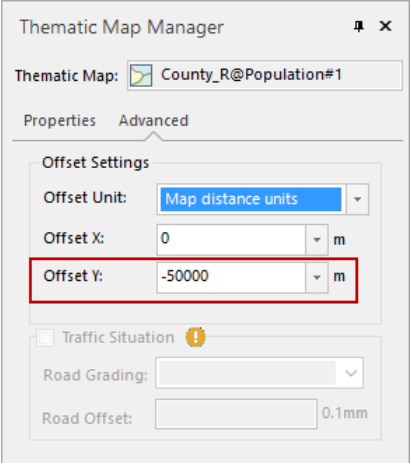
Figure: Setting a vertical offset for the thematic map 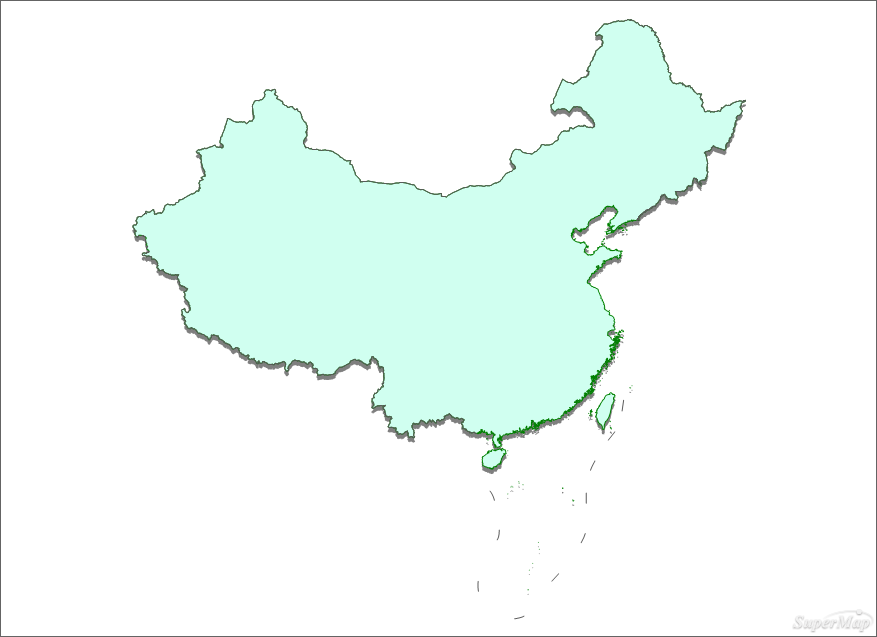
Figure: Three-dimensional effect of the base map - Producing a thematic map for population density range
The isosurface creates a range thematic map with the population density as a expression. Dividing the population density into 13 segments by selecting the method of equidistant segmentation and setting an appropriate color scheme.
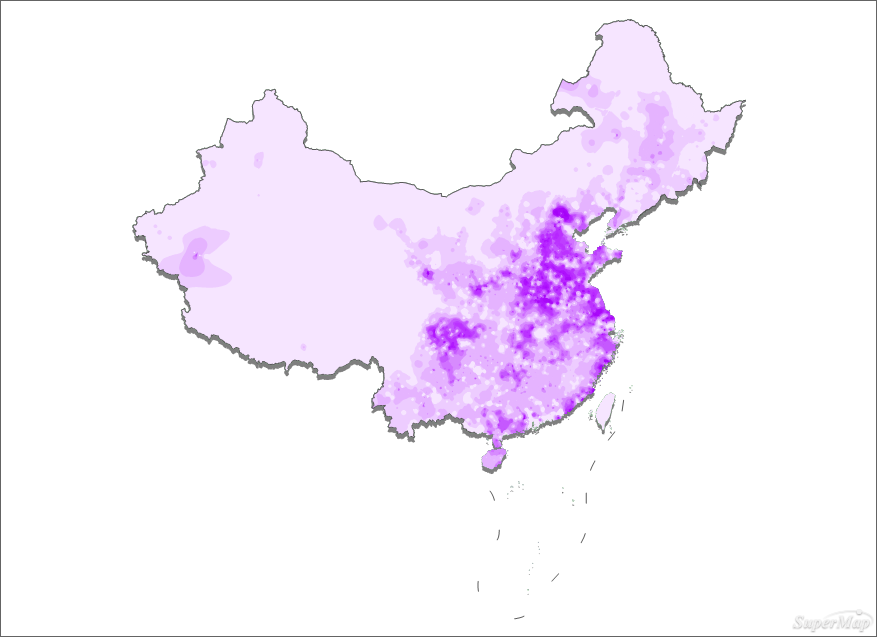
Figure: Ranges Map - Add the provincial capitals and mark
Adding the provincial capitals and producing thematic map for them as marks to intuitively display the national population density distribution while increasing the expressiveness of the map.
- Add other auxiliary elements
(1)Adding Heihe-Tengchong Line (Hu Line), it is proposed in 1935 by the geologist Hu Huanyong, it roughly distinguishes the disparity of population distribution between the southeast and northwest of china.
(2)Adding map name and legend.
Mapping Result
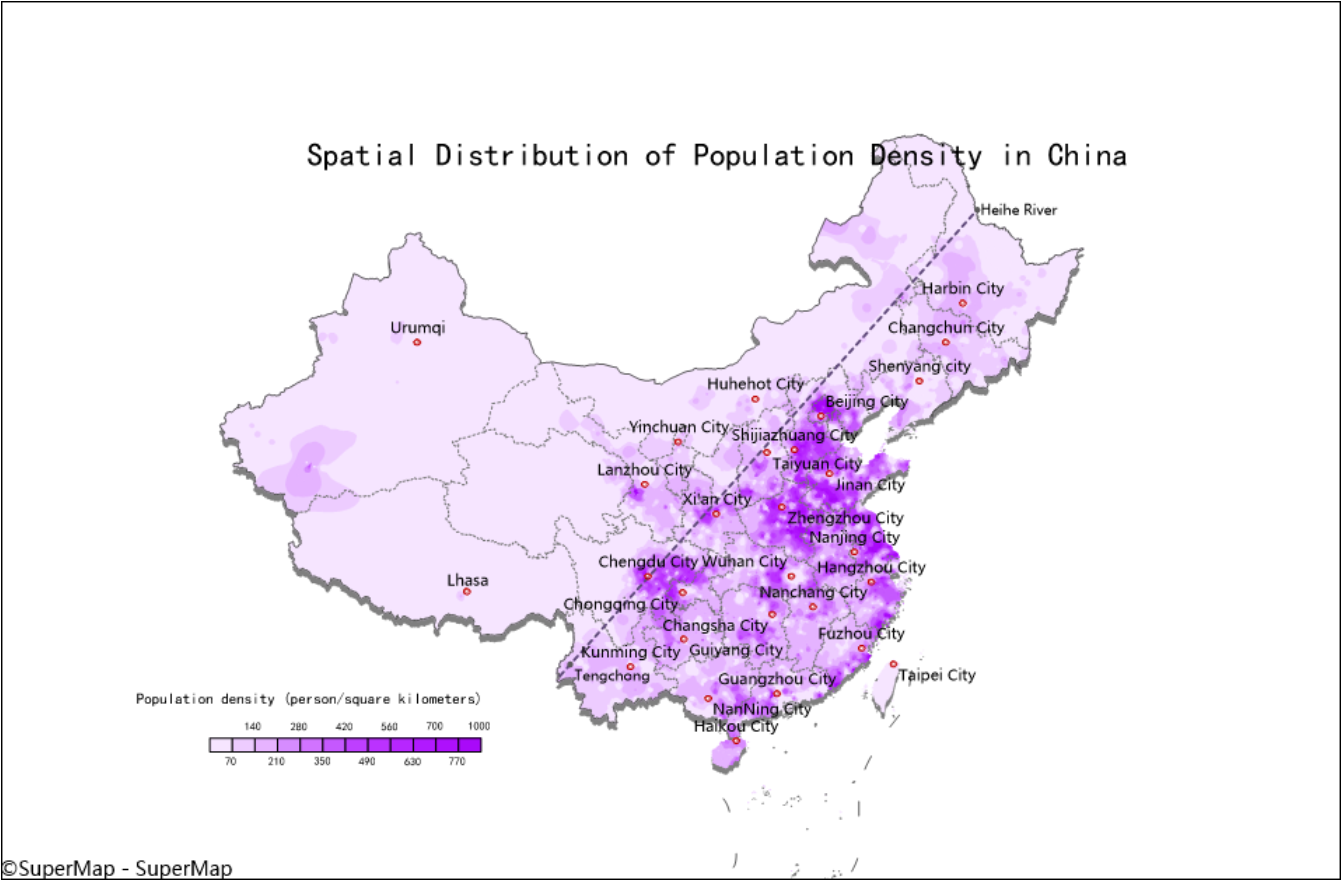 |
| Figure: Spatial Distribution of Population Density in China |