


Both Vector Data and Raster Data can be used to Create Thematic Map. The difference is that the thematic map of Vector Data is based on Attributes in its attribute table, while Raster Data is based on pixel values. SuperMap provides seven thematic maps for Vector Data (point, line, area, and CAD) and two thematic maps for Raster Data (Raster Dataset).
The thematic maps provided for Vector Data include Unique-values Map, Graudated Colors Map, Dot Density Map, Statistical Thematic Map, Graduated Symbols Map、Thematic Label Map、Custom Thematic Map。 In the above thematic maps, except for the Thematic Label Map, other thematic maps do not support CAD. Thematic maps provided for Raster Data include: Grid Graudated Colors Map and Grid Unique-values Map.
Note: Text Dataset and Image Dataset cannot Create Thematic Map.
The thematic map provided has the following features:
- The thematic map is displayed as an independent layer and is not attached to the Normal Layer. Therefore, the thematic map in the map can adjust its Display Order in the map layer according to actual needs.
- For the same Dataset, you can make multiple thematic maps of the same type; you can also make thematic maps of multiple types at the same time. For example, for Region Dataset, you can make thematic maps of All Types provided by Vector Dataset.
- Support the filtering and avoidance of statistical chart.
- For Thematic Label Map, Composite text is supported, that is, different styles can be displayed for different parts of the label of the same feature; complex Thematic Label Map is supported, that is, multiple labels are displayed on the map in the form of matrix; The Thematic Label Map supports the maximum and minimum values for text zooming, that is, when the map is zoomed, the text is zoomed only within the maximum and minimum values.
The Thematic Label Map and Statistical Thematic Map support segment setting. For the same thematic map, the display styles in different segments can be different. For example, when making the Thematic Label Map of national tourist attractions (labeled with the names of scenic spots), users can use the segmentation display function to display the names of scenic spots suitable for different seasons in different colors.
When making the current situation map of Land Use, in order to more intuitively see the distribution area and range of different types of Land Use such as grassland, woodland and residential area, the same type of Land Use is usually given the same color or Fill Style. At this point, the Unique-values Map is used for rendering.
Unique-Values Map classifies features with the same thematic values and sets a rendering style, such as color or symbol, for each category. Features with the same thematic values use the same rendering style to distinguish different categories.
The Thematic variable ofthe Unique-values Map can be a non-numeric descriptive attribute, such as the name, type, and status of an element; It can also be a numeric attribute used for identification, such as the Unique identifier ID of the element, the Land Use type identification number, etc.; Of course, Thematic Variable can also be a numeric attribute representing a quantity. In this case, each numeric element will be given a style. If the number of values is very large and different, it is not recommended to use this method to Create Thematic Map, because it cannot distinguish the data.
Unique-values Map focuses on the qualitative differences of phenomena, and generally does not represent quantitative characteristics. It can be used for geological map, geomorphological map, vegetation map, Land Use Map, political administrative division map, natural division map, economic division map, etc.
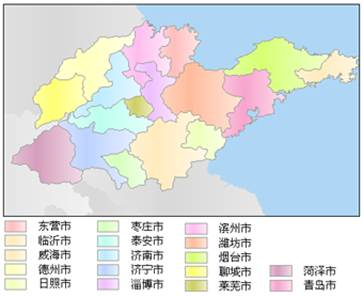 |
| Figure 1: Unique-values Map |
1. General
How can we clearly reflect the intensity of soil erosion whenmaking the distribution map of soil erosion intensity? The answer is to divide the intensity of soil erosion into, say, 6 segments, namely, slight: < 500; mild: 500-2000; moderate: 2000-6000; intense: 6000-10000; extremely intense: 10000-20000; intense: > 20000, in tons/ (km 2 * year). From mild to severe, the color gradually deepens, that is, light red is used for low soil erosion intensity, while dark red is used for high soil erosion intensity, so as to achieve the purpose of clearly reflecting the intensity of soil erosion. Reflected in GIS is the use of Graudated Colors Map for rendering.
In the Graudated Colors Map, the thematic values are divided into a plurality of range segments according to a certain segmentation mode, the elements are distributed to one of the range segments according to the respective thematic values, and the elements in the same range segment are displayed by using the same color, filling, symbol and other styles. The Thematic variable on which the Graudated Colors Map is based must be a numerical type, and the Graudated Colors Map is generally used to reflect the quantity or degree characteristics of a continuous distribution phenomenon, such as the distribution of precipitation, the distribution of soil erosion intensity, and the like.
The following figure is a schematic diagram of a Graudated Colors Map:
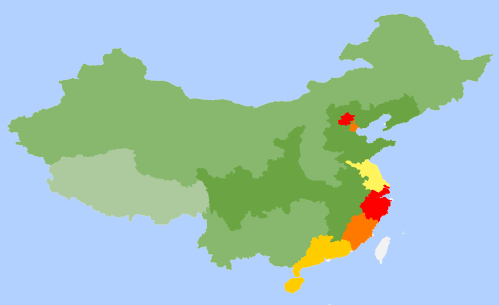 |
| Figure 2: Graudated Colors Map. |
2.Style Settings
The most typicalGraudated Colors Map is to use color to reflect the degree of difference between the segments, such as the precipitation changes from low to high, and the color of the segments generally changes from green to red. When it is necessary to further render the style of each segment, SuperMap provides various Style Settings including color, line type, fill, etc., so that the style of each segment can be set according to the user's needs.
3. Segmentation method
SuperMap provides six segmentation methods. Including Equidistant Interval, Square Root Interval, Standard Deviation Interval, Logarithmic Interval, The Quantile Interval method and the Custom Interval method. These segmentation methods segment according to a certain distance, so the Thematic variable on which the Graudated Colors Map is based must be a numerical type. The Graudated Colors Map obtained by using different segmentation methods are also different; when the Number of segments are different, different Graudated Colors Map will be obtained.
One of the criteria forsegmentation is whether the elements with similar values fall into the same segment, and the two important factors that determine the presentation of Graudated Colors Map are the segmentation method used and the Number of segments. The various segmentation methods provided by the SuperMap component product are described below.
Equidistant Interval method: Equidistant Interval is a segment with equal spacing according to the maximum and minimum values of thematic values and the number of segments set by the user. In an Equidistant Interval, each segment has an equal length. For example, if a field is selected as Thematic variable, its value is from 1 to 10, and now it needs to be divided into four segments with Equidistant Interval method, which are 1-2.5, 2.5-5, 5-7.5 and 7.5-10 respectively.
Note: The segments are closed at the front and opened at the back, namely, 1, 2.5), 2.5, 5), 5, 7.5), 7.5, 10). According to this way of segmentation, there may be no elements in a certain range of segmentation.
Dot Density Map uses dots of the same size and shape to represent the distribution range, quantitative characteristics and distribution density of phenomena. The number of points and the meaning they represent are determined by the content of the map. Dot Density Map uses a certain value Attributes (thematic value) of the layer to map to different levels, and each level uses different numbers or dot symbols representing density to represent the distribution of the thematic value in each partition, reflecting the relative quantity difference of different areas. It is mostly used on maps with quantitative characteristics, such as the classification of grain production, GDP, population, etc. In different regions. It is mainly aimed at regional or planar elements. Therefore, Dot Density Map is applicable to Region Dataset.
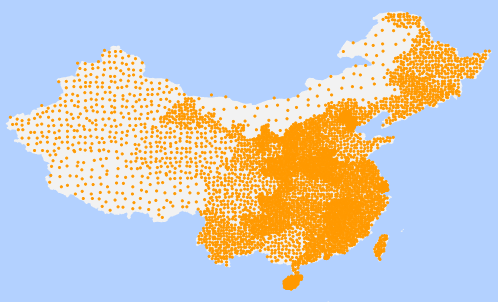 |
| Figure 3: Dot Density Map. |
thematic map:
- Dot Density Map uses the number of points or Density to reflect the thematic value corresponding to an area or range, where a point represents a certain number, and the number of points in an area multiplied by the number represented by the point is the thematic value corresponding to the area. For example, if a city has 2000000 population and one point in the Dot Density Map represents 20000 population, there will be 100 points distributed within the city area.
- In Dot Density Map, for two areas with the same number of points, the points in the smaller area are densely distributed, so the thematic value (or mapping object) of Dot Density Map is quantity, but it reflects density. For example, a Dot Density Map is made for the population of each area, which reflects the population density in the form of a graph, that is, the Density of the dot; Of course, the Graudated Colors Map may be created with the population density as the Thematic variable, and the difference in the population density of the area may be reflected by the difference in color. The more and denser the number of points in the Dot Density Map, the greater the density or concentration of the things or phenomena reflected by the data in the area.
- You can specify the value represented by a single point in the Dot Density Map and its display size. When the numerical value represented by a single dot is too small or the display size of the dot symbol is set to be too large, the dots are stacked on each other, so that the distribution of the phenomenon is not obvious, and thus it is important to set the numerical value represented by the dot and the display size of the dot to be appropriate. When the theme value used to make the Dot Density Map is very large, it is better to set the value represented by the dot to be larger and the size of the dot symbol to be smaller. In the actual drawing, it may be necessary to try several times to find a suitable combination of the value represented by the point and the size of the point display.
- For a Dot Density Map, the style of the dots is consistent. Users can make multiple Dot Density Map for multiple attributes of data, and use different point styles to distinguish different Dot Density Map, so as to show the distribution density characteristics of multiple attributes on a map. The distribution of points in the
- Dot Density Map is random and does not represent the actual distribution location. Even if the relevant settings are exactly the same, the number of points in the thematic map produced each time is the same, but the positions of the points are different.
1. General
The necessary annotation on themap is indispensable, which not only helps users to better distinguish the features, but also shows some important attributes of the features, such as the names of administrative divisions, rivers, organs, tourist attractions, the elevation of contours, etc. In SuperMap, users can easily realize map annotation by making Thematic Label Map.
The Thematic Label Map is used to label objects such as points, lines, and surfaces with thematic values (also called labels). Characters or numeric fields are often used to label information such as place names, Road Names, river grades, and widths. It should be noted here that there are usually legends, map names, scales and so on on the map, which are cartographic elements and do not belong to the category of Thematic Label Map annotation.
In the Thematic Label Map, the display style and position of the label can be set uniformly, and the style of a single label or a label in each segment can also be set separately by means of segmentation.
The Thematic Label Map of the SuperMapcomponent product has four major features. First, the Thematic Label Map can be segmented into Style Settings, that is, the user can set a segmented field expression. The value of the expression is compared with the segment value determined according to a certain segment mode, so that the labels of the elements falling in different segment ranges are set into different styles; secondly, the complex Thematic Label Map is supported, that is, the form of nested labels is supported; The third is to provide composite Style Settings for the text of Thematic Label Map, such as the text "Himalayas", which can display the first three characters in red and the last two characters in blue; the fourth is to support the maximum and minimum values of text zooming, that is, when the map is zoomed, the text is zoomed only within the maximum and minimum values.
 |
| Figure 4: Thematic Label Map. |
2. Control of Label Position
In theThematic Label Map, it is necessary to consider how to place the labels of each element near the position of the element, how to place them beautifully, how to avoid the overlap between the labels, and how to make the relationship between the labels and the elements easy to identify, so it is very important to control the position of the labels.
- interior point
In the case of the Thematic Label Map default and Uniform Settings, the anchor point of the label is the interior point of the feature. To understand the location of the anchor point, first understand the location of the inner point.
The positions of interior points are differentfor different Geometry. The interior point of a point object is the point itself; the interior point of a face object is the point inside the Geometry and near the center; The interior point of the line object is the interior point of the first subobject of the line object (when the line object has only one subobject, the interior point of the subobject is taken). When the subobject has an odd number of nodes, the middle node is taken as the interior point. When the subobject has an even number of nodes (in the case of more than two nodes), the middle value of the middle two nodes is taken as the interior point. When the subobject has two nodes, Take the center of the two nodes as the interior point.
- Anchor and Label Locations In general
, the position of a tag is controlled by its anchor point. The position relationship between the label and the anchor point is set in the style of the label or text. Currently, 12 kinds of position relationships between the label and the anchor point, or called Alignment, are provided to control the placement of the label around the anchor point. They are: Corner Alignment: upper-left corner alignment, lower-left corner alignment, upper-right corner alignment, lower-right corner alignment; Center Alignment: Top Center Alignment, Center Alignment, Left Center Alignment, Right Center Alignment, Bottom Center Alignment; Baseline Alignment: Baseline Left Alignment, Baseline Center Alignment, Baseline Right Alignment.


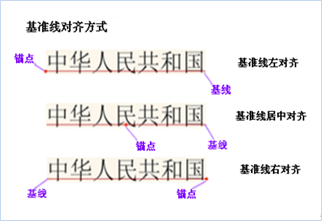
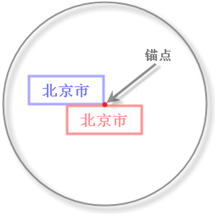
Figure 5: Corner Alignment Figure 6: Center Alignment Method Figure 7: Baseline Alignment For example, for an area feature (circle), its inner point is the center of the circle (red), and the top Center Alignment (pink) and the lower right corner Alignment (blue) are selected to determine the position of the label, then the placement position of the label is as shown in the following figure:
for Different Alignment Determination - Offset The anchor point of the
label can be offset from the interior point of the feature. When the user wants the anchor position of the tag not to be on an interior point, the anchor position of the tag can be controlled by setting the offset of the tag at the X and y points. The value of the offset is a constant value or the value represented by the field expression, that is, if the field expression is SmID, where SmID = 2, then the value of the offset is 2, and the unit of the Offset Settings is the map unit. The offset can be Fixed Size, that is, it can not scale with the zoom of the map.
- Effect and special treatment
In terms of label position setting, SuperMap provides many Effect Settings and special processing to meet different annotation requirements. At this time, the anchor point of the label may have no relationship with the internal point of the feature, including Flow Display, No Overlap, and Traction Line Display. Label Alongline et al. Some effects are not applicable to the features of All Types. For example, Flow is only applicable to the annotation of line and surface features, while Label Alongline is only applicable to the thematic map of line features.
- Flow
For a Geometry that spans a large area and has a line shape and cannot be fully displayed in a Map, if the label position is relatively fixed and the label of the object is invisible in the current Map, the map needs to be translated to view the label information of the object. If the Flow effect is used, the label of the object will be displayed in the current Map even if the object is partially displayed. When the map is translated, the label of the object will move with it to ensure that the label of some or Show All objects in the current Map is visible, so that the label information of each element can be easily viewed. Figure 3 ‑ 10 and Figure 3 ‑ 11 demonstrate the effects of no Flow and Flow, respectively.
Note: The Flow effect cannot be applied to the Thematic Label Map of the point layer.
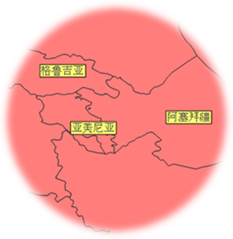
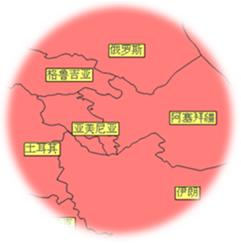
Figure 8: No Flow Figure 10: Flow - No Overlap
When features are close together and the Spatial Range of each feature is small, the anchor point of the label is controlled by the interior point of the feature, and its labels may overlap each other, making the label at the bottom invisible. With the No Overlap function, when the labels overlap, some of the labels will not be displayed relative to the interior point of the feature, so that they do not cover or be covered by other labels, so that each label is visible and does not overlap. Of course, in the case of a large degree of label overlap, even if the No Overlap function is used, the phenomenon of label overlap may not be completely avoided.
- Traction line display
When a label flows, its position is not fixed. Since the traction line always points to the inner point of the element, the element actually corresponding to the flowing label can be found through the traction line display function. Fig. 11 is a Thematic Label Map obtained in the case of a traction wire display.
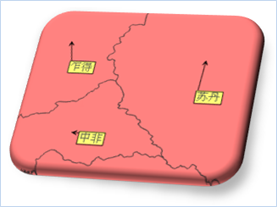
Figure 11: Show Leader Line. - Label Alongline
Polyline generally extends very long. When drawing, it is more beautiful to place the label of Polyline along the line, and the label can appear at a certain length to facilitate the identification of Polyline.
The Label Alongline function provides five directions of Label Alongline, namely, along the line, from top to bottom, from left to right, from top to bottom, from right to left, from bottom to top, from left to right, from bottom to top, and from right to left. When labeling with a direction along a line, the label labels the direction along the line from the start to the end. For the remaining four dimension direction options, each option includes the setting of two parts: the vertical direction (from top to bottom or from bottom to top) and the horizontal direction (from left to right or from right to left). These two parts do not work at the same time. Which part works depends on the direction of the line. The determination method of the line trend is: if it is a straight line, the starting point and the end point of the connecting line, if the included angle between the line and the horizontal direction is less than 60 degrees, the line trend is considered to be horizontal, otherwise it is vertical; for the arc line, the included angle between the tangent line of the arc line at the anchor point and the horizontal direction is considered. For the horizontal line, it is marked according to the setting of the horizontal part in the option (from left to right or from right to left), and the setting of the vertical part (from top to bottom or from bottom to top) is not considered; On the contrary, the vertical line is marked according to the setting of the vertical part in the option (from top to bottom or from bottom to top), and the setting of the horizontal part (from left to right or from right to left) is not considered. For example, if the Label Alongline direction in fig. 12 is from top to bottom and from left to right, the labels 14 and 15 are labeled from top to bottom, and the labels 16 and 17 are labeled from left to right.
Note: When Label Alongline, the position of the label will change depending on whether the angle is fixed. If the angle is fixed, all labels are displayed according to the Rotation angle of the font in Text Style Settings, regardless of the direction of Label Alongline; If the angle is not fixed, both the Rotation angle of the font and the direction of the Label Alongline are considered during Show Lable. The direction of Label Alongline in Figure 12 and Figure 13 is from top to bottom and from left to right; the Rotation angle of the font is 0. The difference is that one is a non-fixed angle and the other is a fixed angle.
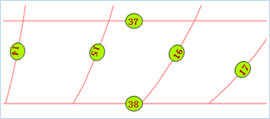
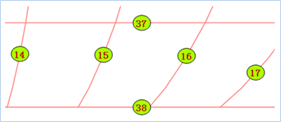
Figure 12: Unfixed angle Figure 13: Fixed angle - Map repeat If
a Line Dataset has a record composed of multiple sub-line segments, there will be multiple duplicate labels on the map when the Thematic Label Map is made based on any field and Label Alongline is set. For Example, for the line data representing the 5th Ring Road in Beijing, if it is composed of four sub-line segments and the name field (5th Ring Road) is used as the Thematic variable to make the Thematic Label Map (Label Alongline), if the "Avoid Repeated Marking in Map" option is not selected, the following steps can be taken: The Display Effects is shown in the left figure of Figure 14. If you select to avoid repeated annotation of the map, the system will regard the four sub-lines of this line as one line for annotation. The Display Effects is shown in the right figure of Figure 14.
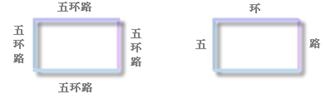
Figure 14: Map repeat annotation
- Flow
 |
| Figure 8: Label Position Map |
3.Label Style
- Text Style The settings of the
label Text Style include font, Alignment, Font Size, font height, font width, font Rotation angle, foreground color, background color, etc. In addition, some Font Effects are provided, such as bold, italic, shadow, outline, and strikeout. Transparent or not, and so on. When the background of the text is set to be opaque, the background color is the background color of the text. When the Background Transparency is set and the text is displayed in the contour mode, the background color is the color of the contour line. The foreground color of the font is the color of the font. The Alignment of the font is the font. For the Relative and Details of the anchor point, see the introduction of the label position. In addition, the size of the font generally corresponds to the height of the font. If you change the Font Height, the size of the font will change accordingly, and vice versa.
provides a setting for the display precision of numbers, that is, if the display precision is set to 0.1, an object with a field value of 178.3129 will be displayed as 178.3 in the Thematic Label Map; The maximum and minimum height (width) settings are provided for the text. This setting can control the size of the font when the map is zoomed in, that is, when the map is zoomed in, the font will also be enlarged, but the maximum height (width) will not be exceeded. The premise of this setting is that the font is not Fixed Size.
- Text Composite Composite Style Settings
for text, that is, users can make the text of the label display different styles, such as the text "Himalayas", the first three words can be displayed in red, and the last two words can be displayed in blue. To set different styles for the same text is essentially to segment the characters of the text, and the characters in the same segment have the same display style. There are two ways to segment characters, one is to segment the text with Separator, and the other is to segment according to the segment index value.
Use the Separator to segment the text: for example, use "& &" as the Separator, which divides the text "5 & & 109" into two parts "5" and "109". When displayed, "5" and the Separator "& & "Uses the same style. The string" 109 "uses the same style.
Segmentby using the segment index value: the index value of the character in the text is an integer starting with 0, for example, the index value of the first character ( "bead") of the text "Mount Qomolangma" is 0, the index value of the second character ( "bead") is 1, and so on; When the segment index values are set to 1, 3, 4, and 9, the corresponding character segment ranges are (-∞, 1), 1,3), 3,4), 4,9), 9, + ∞), and it can be seen that the character with index number 0 (i.e., "bead") is in the first segment. The characters with index numbers 1 and 2 (i.e., "Mu" and "Lang") are in the second segment, the character with index number 3 (i.e., "Ma") is in the third segment, the character with index number 4 ( "Feng") is in the fourth segment, and there are no characters in the remaining segments.
- Background style There are seven types of
label setting background shape styles: rectangle, Rounded Rectangle, ellipse, diamond, triangle, circle and symbol. The symbol background can select a dot symbol in the dot symbol library as the background of the label. For example, the label Background shape of fig. 12 is an ellipse. The Style Settings of the shape to the background are the same as the Style Settings of the face symbol.
4. Segmented Display of Thematic Label Map
TheThematic Label Map can be segmented to set the style of the label in each segment, that is, the user can set a segment field expression, and compare the value of the expression with the segment value (determined according to a certain segment mode). To determine the segment range to which the feature belongs, and then set the labels of the features that fall within different segment ranges to different styles.
5. Understanding complex Thematic Label Map
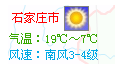
Complex labels are arranged in the form of a matrix and then displayed on the map. A matrix of tag elements used to make complex tags. Can be pictures, symbols, Thematic Label Map, etc. Note that each matrix label element can be further partitioned as a matrix label. For example, in a weather project, a complex tag can be made according to multiple fields, and the complex tag contains image information and Text Info, as shown in Figure 15.
 |
| Figure 15: Complex Labels |
1. General
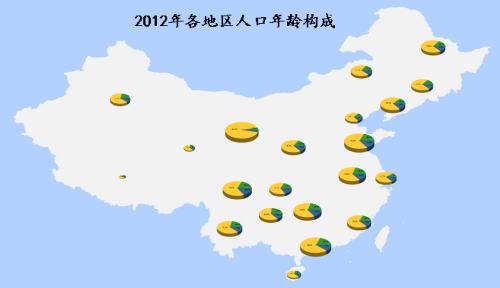
The Statistical Thematic Map reflects the magnitude of the corresponding thematic value by drawing a statistical chart for each feature or record. Statistical Thematic Map can be based on multiple variables and reflect multiple attributes, that is, multiple thematic values can be plotted on a statistical map. The Statistical Thematic Map allows for a horizontal and vertical contrast between the region itself and the regions. It is mostly used on maps with relevant quantitative characteristics, such as grain production, GDP, population in different regions for many years, passenger traffic in different periods, subway traffic, etc.
For example, when counting the number of tourists in each quarter of Beijing tourist attractions, the fields Pop1, Pop2, Pop3 and Pop4 (representing the number of tourists in four quarters respectively) can be used as Thematic variables on the Beijing tourist map. Make a Statistical Thematic Map of the number of tourists, so that you can see the number of tourists in each scenic spot in a certain quarter, but also can intuitively compare the number of tourists in each quarter of a scenic spot.
 |
| Figure 16: Statistical Thematic Map. |
2. Learn more about Statistical Thematic Map
- Statistical Thematic Map and Statistical Chart
Statistical Thematic Map and statistical chart are two different concepts. In the Statistical Thematic Map, each area will have a statistical chart representing each thematic value of the area, and the statistical chart has various forms of expression. Currently, the provided Diagrams include: Area Chart, Ladder Chart, Broken Line Chart, Dot Chart, Column Chart, 3D Bar Chart, and Pie Chart. 3D Pie Chart, Rose Chart, 3D Rose Chart, Ring Chart, Stacked Bar and 3D Stacked Bar Chart (see Figure 17 for various statistical charts). By way of example, fig. 16 is a Statistical Thematic Map.

Figure 17: Diagrams Type - Rating Mode Thematic map classification mode is used to
determine the size of the statistical map and the proportion of each thematic variable in the statistical map, which is mainly used in Statistical Thematic Map and Graduated Symbols Map. The main purpose of grading is to reduce the difference between data sizes in Create Thematic Map. If the difference between the data is large, the logarithmic or square root grading method can be used, which reduces the absolute size difference between the data, makes the visual effect of the thematic map better, and at the same time, the comparison between different categories is meaningful. The classification modes provided at present are: constant classification mode, logarithmic classification mode and square root classification mode. Logarithmic and square root grading is not allowed for fields with negative values.
Constant grading mode (CONSTANT): The grading operation is based on the linear proportion of the original value in the attribute table.
Square-root grading mode (SQUAREROOT): The grading operation is based on the linear proportion of the square root of the original value in the attribute table.
Logarithmic grading mode (LOGARITHM): The grading operation is performed according to the linear proportion of the natural logarithm of the original value in the attribute table.
- How to determine the size of the statistical chart The Display Size of the statistical chart is determined by the maximum value of the statistical chart
display, the classification mode and the maximum value of the theme. The maximum value displayed in the statistical chart includes the maximum value and the minimum value displayed in the statistical chart. The Display Size of all statistical charts changes gradually between the maximum value and the minimum value. The size of the statistical chart corresponding to the same element varies with the classification mode.
Thematic Maximum includes the thematic maximum and minimum values. Take the maximum and minimum values for the thematic values corresponding to each Thematic variable, and add these maximum and minimum values respectively to form thematic maximum and minimum values. For example, a thematic map has two Thematic variables, field ID and field SmID. The maximum field value of the field ID is 25, and the minimum is 1. The maximum field value corresponding to the field SmID is 10, and the minimum is 5, so the maximum thematic value of the thematic map is 35 (i.e. 25 + 10), and the minimum is 6 (i.e. 1 + 5).
Note: The sum of the thematic values of an element determines the size of the statistical chart corresponding to the element. Each thematic value of an element determines the proportion of the Thematic variable in the statistical chart.
Correspondence: give the maximum and minimum values displayed in the statistical chart and the maximum and minimum values of the topic, and calculate the linear coefficient by using the linear relationship; then calculate the size of the statistical chart corresponding to each element according to the calculated linear equation. Take the histogram as an example: there are two Thematic variables in a thematic map, which are the field Val1 and the field Val2; if the classification mode is CONSTANT, the maximum display value set by the user is 20, and the minimum value is 10; The thematic maximum and minimum values calculated by the system from the thematic values are 10 and 6, respectively, and the linear equation determined by the displayed maximum and thematic maximum values is Y = 2.5 X-5. If the Val1 value of an element A is 2 and the Val2 value is 6, then the sum of the thematic values of the element A is 8. According to the linear equation, the size of the histogram corresponding to the element should be 15 (different Diagrams represent different meanings, for example, for a pie chart, the size represents the diameter of a circle). For the histogram, this means that the total height of the histogram corresponding to element A is 15 (the column width of the histogram is set by the user through the ThemeGraph. BarWidth attribute). Since the ratio of the thematic values Val1 and Val2 is 1:3, the height of the column representing the thematic value Val1 in the histogram is 3.75. The height of the column representing the thematic value Val2 is 11.25.
Note: The unit of the above value is the same as the map unit, that is, if the map unit is meter, the unit of the height value is also meter.
- Statistical Thematic Map shows Effect Settings Like Thematic Label Map,
Statistical Thematic Map can also be used to set whether the statistical chart flows, whether it is No Overlap, whether it is Show Leader Line, and whether it is offset. Whether the offset is fixed, etc. In addition, you can also set the coordinate axis of some types of statistical charts and the style of the statistical chart itself.
- Setting of Chart Axis Whether to show axis can be set
for the coordinate axis of statistical chart; If it is displayed, you can also set the color of the coordinate axis, whether to Show Grid on the coordinate axis, and the text annotation of the Whether to show axis. If the text annotation is displayed, you can also set the style of the axis text. The coordinate axis shown in Figure 18 is set to: Axis Color is black, Show Grid, and the text annotation is displayed.

Figure 18: Axis Settings - Setting of Statistical Chart
For the statistical chart, you can set whether the statistical chart is Fixed Size when zooming in or Zoom Out, or whether the text annotation on the statistical chart is displayed. If text annotations are displayed, you can set the Statistical Thematic Map text display format and the Text Annotation style. There are several formats for displaying Statistical Thematic Map text, such as percentage, real value, title, title + percentage, and title + real value.
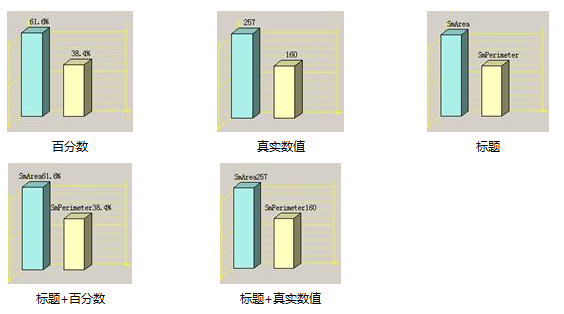
Figure 19: Statistical Thematic Map Text Display Format - No Overlap Settings for Statistical Charts
For statistical charts, avoidance settings can also be made like the labels of Thematic Label Map. When making Statistical Thematic Map and Thematic Label Map for Dataset at the same time, if the statistical chart does not display the text label, even if the label of Thematic Label Map overlaps with the statistical chart, both of them can be displayed normally; If the statistic chart displays text labels, when the text labels in the statistic chart and the labels in the Thematic Label Map are not overlapped, both of them can be displayed normally. However, if they are overlapped, the text labels in the statistic chart will be filtered out and only Show Lable will be displayed.
- Other settings
In addition to the above settings, you can also select whether to display data with negative attribute values; for column chart, 3D Bar Chart, Stacked Bar and 3D Stacked Bar Chart, you can set the column width; For Rose Chart or 3D Rose Chart, you can set the slice angle; for Pie Chart, 3D Pie Chart, Rose Chart and 3D Rose Chart, you can set the Start Angle.
- Setting of Chart Axis Whether to show axis can be set
3. Segmented Display of Statistical Thematic Map
The Statistical Thematic Mapcan be segmented to set the style of the statistical chart in different segments, including the color, filling and other styles of the statistical chart.
4. Memory Array Mode Create Thematic Map
There are two ways tomake Statistical Thematic Map, one is to use expression to Create Thematic Map, the other is to use memory array to Create Thematic Map. The expression mode is to use the fields in the Dataset to make Thematic variable through the combination of a series of expressions; the memory array mode is to store the external values in the memory and use these values to replace the original thematic values to Create Thematic Map.
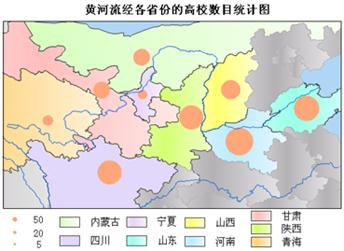
In order to intuitively see the number of colleges and universities in the provinces through which the Yellow River flows, we can make a Graduated Symbols Map about the number of colleges and universities, as shown in the following figure. Through the size of the symbols, we can intuitively see the relative number of colleges and universities through which the Yellow River flows.
 |
| Figure 20: Graduated Symbols Map. |
Graduated Symbols Map is represented on the map by a set of Graduated Symbols according to a certain classification method based on a certain quantitative characteristic of each element, so as to present the relative relationship of the quantitative characteristic among the elements.
Graduated Symbols Map are mostly used on maps with quantitative characteristics, such as the classification of grain production, GDP, population and so on in different regions. The theme Variable type used to make the Graduated Symbols Map is numeric.
How to Determine the Size of the Display of
Graduated Symbols TheDisplay Size mainly depends on the following factors: the size of the dot symbol (i.e., the symbol in the Graduated Symbols Map), the reference value of the Graduated Symbols Map, and the size of the statistical value calculated according to the hierarchical mode.
The dotted Marker Size is not the Display Size of the symbol in the Graduated Symbols Map. For a Graduated Symbols Map, the size of the dot symbol is uniform. Because the thematic value of each feature is different, the final dot Marker Size displayed in the thematic map will be different.
There are three types ofstatistical grading patterns: constant, logarithmic, and square-root. In the Graduated Symbols Map, the values used to determine the Marker Size are different in different classification modes, the constant classification mode is performed according to the Source Data of the field, the natural logarithm is taken for the thematic value corresponding to each element in the logarithm classification mode, and the square root is taken for the thematic value corresponding to each element in the square root classification mode. Use the final result to determine the size of the Graduated Symbols.
The reference value is set by the user, and the larger the reference value is, the smaller the final Display Size of the dot symbol is.
Graduated Symbols Display Effect Settings: Graduated Symbols Map can also be like Thematic Label Map and Statistical Thematic Map. Set Flow Display, Show Leader Line, offset, and fixed offset. The difference is that the Thematic Label Map is for the label, while the Statistical Thematic Map is for the statistical chart. The Graduated Symbols Map is for symbols. In addition to the above settings, the user can also set whether to display features with negative or zero thematic values, and the style of Graduated Symbols when the thematic values are positive, negative, or zero.
Grid Unique-Values Map is used to classify pixels with the same attribute value and set a color for each category, so as to distinguish different categories. The Grid Unique-Values Map is applicable to both discrete Raster Data and partially continuous Raster Data. For those continuous Raster Data with different cell values, it does not make sense to use the Grid Unique-Values Map.
After understanding the Unique-values Map, it is easier for theuser to understand the Grid Unique-values Map, because the two types of thematic maps are only different in some details except the Operation object. The following compares the differences between the two types of thematic maps to help users understand the Grid Unique-values Map.
- The Operation object
- of Unique-values Map is Vector Data, and the Operation object of Grid Unique-values Map is Raster Data. The thematic value
- of Unique-Values Map is the field value of the feature or the value of the field expression, while the thematic value used by Grid Unique-Values Map is the attribute value of the pixel in Raster Dataset. The Style Settings of
- the Unique-values Map subitem include Color Style Settings, Fill Style Settings, Symbol Style Settings, etc. There is only one Color Style Settings for the Grid Unique-values Map subitem.
 |
| Figure 21: Grid Unique-values Map |
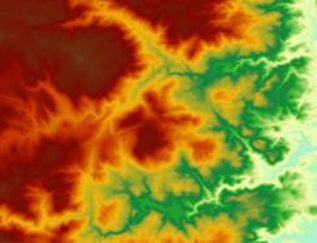
Grid Graudated Colors Map, the attribute values of all pixels are divided into a plurality of range segments according to a certain segmentation mode, and the pixels with the attribute values in the same range segment are displayed with the same color. Grid Graudated Colors Map is generally used to reflect the quantity or degree characteristics of continuous distribution phenomena. For example, in the national Rainfall Distribution Map of a certain year, the Raster Data generated by the interpolation of the observation values of each meteorological station is displayed in segments.
After understanding the Graudated Colors Map, it is easier forusers to understand the Grid Graudated Colors Map, because the two types of thematic maps are only different in some details except the Operation object. The following compares the differences between the two types of thematic maps to help users understand the Grid Graudated Colors Map.
- The Operation object of the
- Graudated Colors Map is Vector Data, and the Operation object of the Grid Graudated Colors Map is Raster Data;
- The Vector DatasetGraudated Colors Map supports all segmentation methods, while the Grid Graudated Colors Map supports only four of them. Equidistant Interval, Square Root Interval, Logarithmic Interval, and Custom Interval; The thematic value of the
- Graudated Colors Map is the field value of the feature or the value of the field expression, while the thematic value used by the Grid Graudated Colors Map is the attribute value of the cell in the Raster Dataset. The Style Settings of each segment in the
- Graudated Colors Map include Color Style, Fill Style, Marker Style, etc., while in the Grid Graudated Colors Map, There is only one color, Style Settings, and each segment is distinguished by a different color.
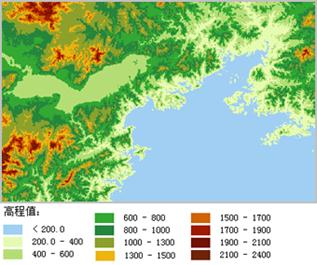 |
| Figure 22: Grid Graudated Colors Map. |