


Openness Analysis
Instructions for use
3D Openness Analysis is to construct a "view hemisphere" based on a certain View Radius: relative to the specified observation point in the scene, analyze the openness of the area, and simulate the view range of the space around the characteristic observation point.
Application scenario
The Openness Analysis function can be used to carry out Spatial Analysis for urban parks, urban squares, urban pedestrian streets, urban waterfront areas and other activities related to residents'lives, and can also measure the distance between buildings, the density of buildings, and judge the proportion of the sky that can be seen at the current location. Intuitively show and analyze the openness of the space, and evaluate the impact of the design on daily life.
Operation steps
- Add data to the scenario for Openness Analysis.
- On the 3D Analysis tab, in the Spatial Analysis group, click
 the button to pop up the 3D Spatial Analysis panel.
 - Click the Add button and move the mouse to the scene. When the mouse status changes to a red dot, you can click Select Observation on the data surface to perform Openness Analysis.
- 3D Openness Analysis can set Viewer Info and View Position:
- View Position: The position of the observation point can be modified by modifying the coordinate values of the observation point in the X, Y, and Z numerical input boxes respectively.
- Parameters of Analyst Result can be set in the Parameter Settings area, including observation radius, Fill Color, Display Mode, wireframe color and analysis precision, and the visible part and invisible part of observation openness can be selected:
- Observation Radius: It is used to set the radius of the half sphere of the view field of Openness Analysis. The default value is 100 meters.
- Fill Color: Used to set the fill color of the view hemisphere surface of Openness Analysis.
- Display Mode: There are three modes available: Fill Mode, Fill And Line, and Line Frame Mode. You can modify the Display Mode of the viewport hemisphere.
- Wireframe Color: You can set the color of the wireframe on the surface of the view hemisphere of Openness Analysis.
- Analysis Precision: Set the quality level of Analyst Result, including low level, medium level and high level.
- Display Visible or Invisible Area: You can set to display the Analyst Result as a visible or invisible part of the viewport hemisphere.
- The toolbar area of the panel provides operations such as add, delete, import, export and Save Analysis Results of observation points. The effect drawing of
- openness is as follows:
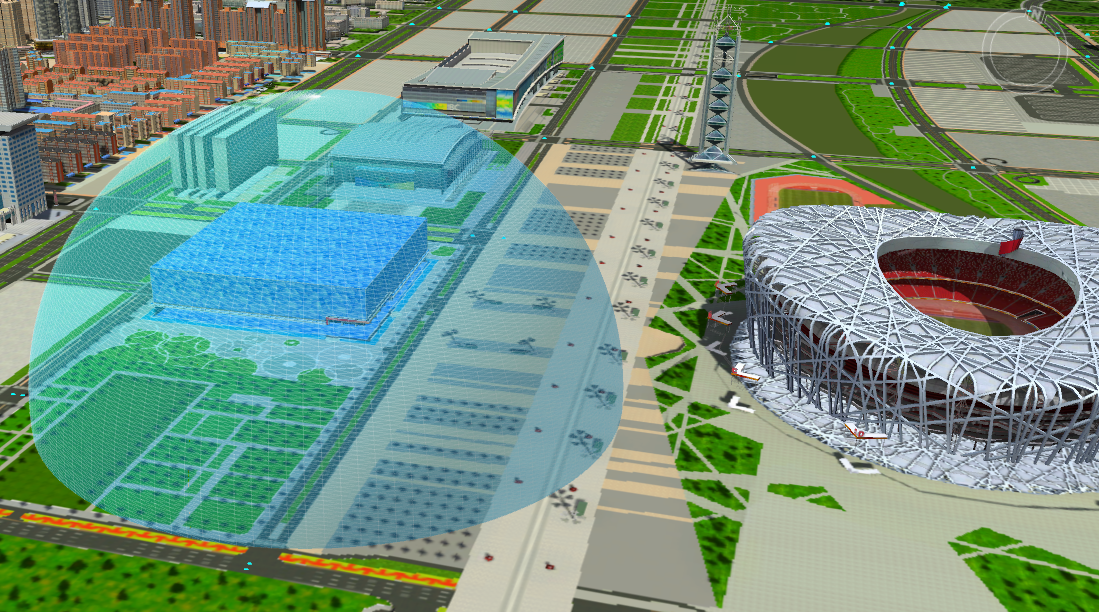
Figure: Openness Analysis rendering - Openness Save Result is as follows: of the opening degree
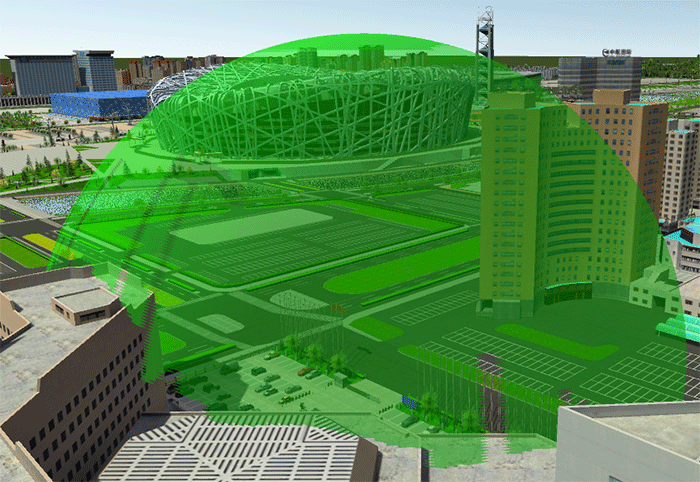
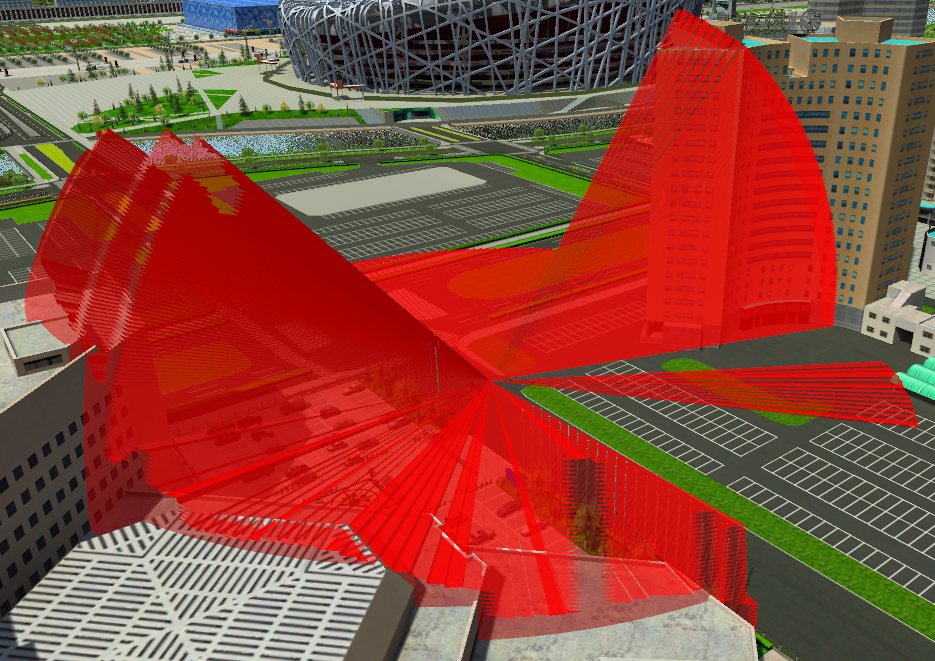
Figure: Openness Visible part of the surface Figure: Invisible part of the body
 Button: The position of the observation point can be determined by clicking the mouse.
  Button to remove the Openness Analysis record selected in the panel.
  Button: used to import 3D Point Dataset as observation point, set Parameters and perform Openness Analysis. Parameter Settings of "Import View Point" dialog box is shown as follows:
  Button: Export as Point dataset of observation points recorded by Openness Analysis, and save the observer position and observation radius to the attribute table. The specific parameters are as follows:
  Button: Save Openness Analysis results.