


Street Facade Map
Instructions for use
The elevation reflects the appearance of the building and the effect of the facade decoration. In the three-dimensional building scene, the generated elevation is used to evaluate the beauty of the building group intuitively, and the buildings that affect the beauty of the elevation are easily obtained.
"Street Facade Map" function supports the generation of corresponding vector surface data, which brings convenience to the construction planning industry and provides decision support. ".
Operation steps
- Load the Datasource containing the 3D Scene, and SceneAdd to New Spherical Scene the 3D data.
- On the 3D Analysis tab, in the OSGB group, click the Street Facade Map
 button to bring up the Street Facade Map "panel.
 - In the toolbar, click the Draw Line
 button. With a red dot attached to the mouse, you can draw a line in the scene. The left side of the drawing direction is the building of the elevation to be generated.
 - Set the resolution, Bottom Altitude, maximum height, maximum distance, File Name, and 2.5D Vector:
- Resolution: the default value is 0.5, and the unit is m/pixel. The value can be adjusted through the up and down arrows on the right side of the resolution. It is supported to directly input the value. The smaller the value is, the higher the resolution is.
- Bottom Elevation: The default value is 0, and the unit is meter, indicating that the elevation is plotted upward from the ground level. The value can be adjusted through the up and down arrows on the right side of Bottom Altitude, and direct input of the value is supported.
- Maximum Height: default value is 100, and the unit is meter, indicating that the height range of the plot is 100 meters from Bottom Altitude. The value can be adjusted through the up and down arrows on the right side of the maximum height, and direct input of the value is supported.
- Maximum Distance: The default value is 500, and the unit is meter, which indicates the maximum distance from the drawing line and determines the distance range of the plot. The value can be adjusted through the up and down arrows on the right side of the farthest distance, and direct input of the value is supported.
- File Name: It is stored in the C drive by default, and the plot format is tiff. Enter the plot path directly or click the "File Browse" button on the right to Select Path.
- When "Build Vector Region" is checked, determine the Dataset stored in the vector plane and the Datasource where the Dataset is located.
- Click the "OK"
 button to generate the elevation. Sample Data results are as follows:
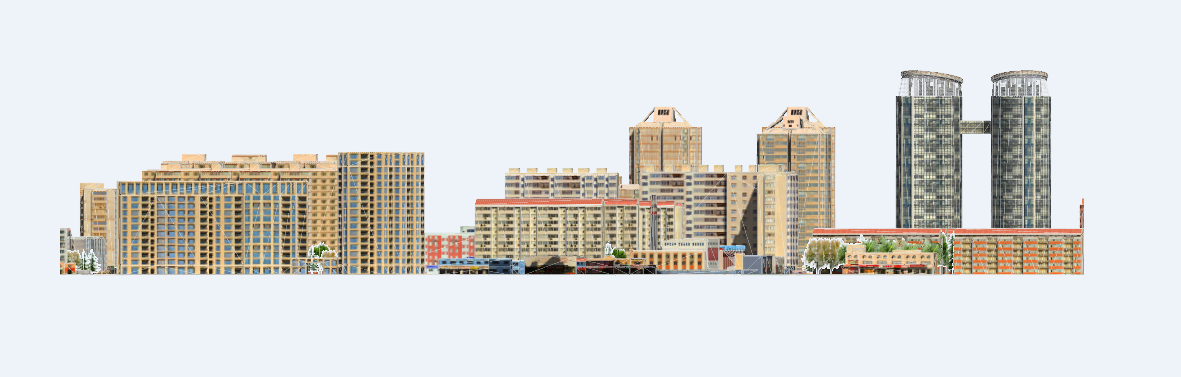 |
| Figure: Demonstration Elevation Results |
 Precautions
- When the data is large, it is necessary to Generate Cache the data before executing the Street Facade Map function, otherwise the software may flash back.