


Isoline Analysis
Instructions for use
The Isoline Analysis function in 3D Spatial Analysis can extract the isoline of the specified area according to the pixel value of Raster Data. The Dataset used for Isoline Analysis must be a Raster Dataset such as DEM or Gird.
Operation steps
- To add Raster Data to your scene for Isoline Analysis, click the Isoline Analysis
 button in the Spatial Analysis group on the 3D Analysis tab.
 - When a red dot is attached to the top of the mouse, it is ready for drawing. Click the left mouse button on the data surface to determine the starting position of the polygon. After determining the two vertices, move the mouse to see the preview effect of isoline extraction within the polygon range. Click the left mouse button again to determine the polygon range of Isoline Analysis. Click the right mouse button to end the drawing.
- After identifying the Isoline Analysis area, you can continue to add Isoline Analysis ranges or delete Analyst Results in the 3D Spatial Analysis Properties toolbar.
- The Parameter Settings "enables you to set the visualization of the value line Analyst Result. Include Display Mode, Line Color, Texture Color Table, Transparency, Color Table Min Elevation, Color Table Max Elevation, Min Visible Elevation, Max Visible Elevation, and Equidistance. You can select one or more results in the Analyst Result list to set:
- Display Mode: It is used to set the Display Mode of Extraction Result. There are three display modes that can be set: wired display, area display and Line-Region mixed display.
- Line color: Click the Drop-down Button on the right to set the display color of the contour line.
- Texture Color Table: It is used to set the Texture Filling color of the analysis area. The color displayed is different if the elevation value of the corresponding area is different.
- Transparency: It is used to set the transparency of Texture Filling and isoline in the analysis area. The default value is 0.
- Color Table Minimum Elevation: Sets the minimum elevation value for the color table below which regions are not assigned a color. Color Table
- Maximum Elevation: Sets the maximum elevation value for the color table above which regions are not assigned a color.
- Minimum Visible Elevation: Sets the minimum elevation value at which isolines are extracted. Regions less than this value will not extract isolines.
- Maximum Visible Elevation: Sets the maximum elevation value at which isolines are extracted. Regions greater than this value will not extract isolines.
- Isometric Distance: refers to the interval value between two adjacent isolines. The unit is m, and the default value is 100.
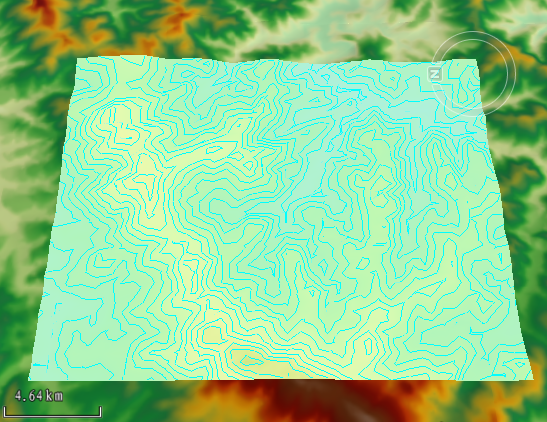 |
| Isoline Analysis results |
 Button: used to draw the polygon area participating in Isoline Analysis.
  Button: Use to select a 3D face in the scene as the analysis area.
  Button: used to remove the selected analysis record in the Analyst Result list.
  Button: to import the 3D Region Dataset participating in the analysis.
  Button: for Export analysis range. You can determine whether the exported 3D Region Dataset is accompanied by the following Property Fields: Name, Minimum Visible Height, Maximum Visible Height, and Isometric by checking the checkbox.