


Overview
Transportation Analysis brings convenience to business, public service and daily life, and Analyst Result provides effective implementation solutions to help users make more rational decisions. Transportation Analysis can help solve the following real-world problems:
- What is the shortest route from point a to point B?
- To travel to a scenic spot, how to choose a route to complete as many scenic spots as possible at one time?
- What is the customer coverage area of a newly opened supermarket and how to determine the purchase volume?
- After a fire, how to dispatch the nearest fire engine for rescue?
- How can a distributor in Dongcheng District complete all express delivery tasks in the shortest time?
In the world of geographic information, public infrastructure (power facilities, telecommunications and cable television networks, road traffic, water networks, etc.) Is abstracted as a "network system". A network system is a mesh system composed of many interconnected line segments, and a network model is an abstract representation of a network system in the real world. For example, in the urban traffic network, Polylines such as roads are abstracted as line segments, which are called network arcs in the network, while point-like objects such as intersections and bus stops are abstracted as points, which are called network nodes in the network. In the network model, resources and information can travel from one node to another along an arc. It can be understood that the network is composed of elements such as edges (lines) and intersections (nodes), which represent possible paths from one location to another.
Basic concepts
A network is a model consist of a set of interrelated arc, nodes, and their attributes. Networks are used to express real-world roads, pipelines, and so on.
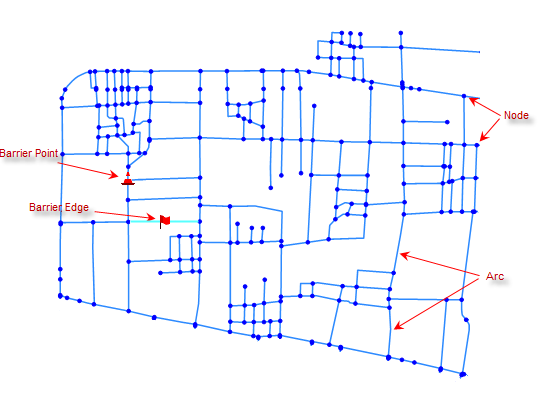 |
| Figure: Network diagram |
As shown in the above figure, the network not only has the abstract Topology between arcs and nodes of the general network, but also has the geometric positioning characteristics and geographic attribute characteristics of GIS Spatial Data (Topology is the relationship between geographic objects in spatial location, such as the connection relationship between nodes and lines, lines and surfaces).
The following describes the basic concepts involved in the network model:
- Node
- Arc segment
- Network Resistance
- Center point
- Obstacle Edge and Obstacle Point
- Steering Table
A node is a point in the network where arcs are connected, as shown in the figure above. Nodes can represent point elements such as road intersections and river junctions in reality. Each node and arc corresponds to an attribute table, and their adjacency is related by the fields of the attribute table.
An arc is an edge in a network that is connected to other arcs by a node. Arc segments can be used to represent highways, railways, transmission lines in power grids and rivers in hydrological networks in the real world. The interconnections between the arc segments are topological.
In real life, starting from the starting point, through a series of roads and intersections to reach the destination, there will inevitably be a certain cost. This cost can be measured in terms of distance, time, currency, etc. In the network model, the cost through nodes or arcs is abstracted as the network resistance, and the information is stored in the Property Field, which is called the resistance field.
A hub is a discrete device in that network that has the ability to accept or provide resource and is located at a node. Facilities refer to the material, resources, information, management and cultural environment needed by GIS. For example, there are educational resources in schools, and students must go to school to study. Retail warehouses store the goods needed by retail outlets, and need to deliver goods to each retail outlet every day. A central point is essentially a node on the network.
Traffic congestion can be seen everywhere in the city. Traffic congestion is a random and dynamic process without rules to follow. In order to reflect the current situation of the traffic network in real time, it is necessary to make the arcs of traffic jams have the characteristics of temporary Forbid to Pass, and at the same time, when the traffic returns to normal, the attributes of the arcs can also return to normal in real time. The concept of obstacle edge and obstacle point can solve the above problems well. The advantage of introducing barrier edge and barrier point is that whether the barrier is set or not has nothing to do with the existing network environment parameters, and has relatively independent characteristics.
Turning is the process of going from one arc segment to the adjacent arc segment through the middle node. The turn cost is the cost required to complete the turn. The steering table is used to store the steering cost value. The turning table must list all possible turns at each intersection, which generally includes four fields: Start Edge Field (FromEdgeID), End Edge Field (ToEdgeID), Node ID Field (NodeID) and Turn Cost Field (TurnCost). These fields are associated with the fields in the arc and the node, and each record in the table represents the arc cost required for a way to pass through the intersection. The cost of turning is usually directional, and the negative cost of turning is generally forbidden to turn.
For example, when conducting Network Analysis on a road, we often encounter intersections, three forks, etc. As shown in the figure, the left side is a schematic diagram of an intersection, and the table on the right side is the steering table corresponding to the intersection. The steering table records the steering of vehicles at the intersection and the cost required for turning.
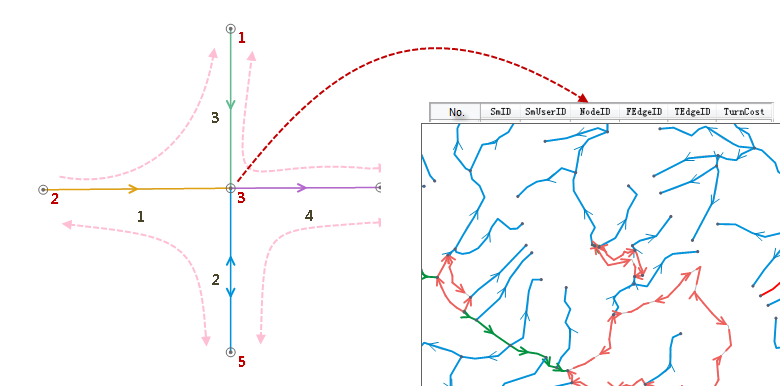 |
| Figure: Turning Intent |