The Graudated Colors Map is to divide the attribute value into different continuous paragraphs (subsection range) by using a certain field attribute of the layer, and each paragraph uses different symbols (line type, filling or color) to represent the overall distribution of the Property Field, so as to reflect the relationship between the attribute value and the object area. Graudated Colors Map shows quantitative characteristics of a region, such as region-specific sales figures, household income, or GDP, or shows rate information such as population density. The Graudated Colors Map supports Create a ranges thematic map. For DGM and GRID layers.
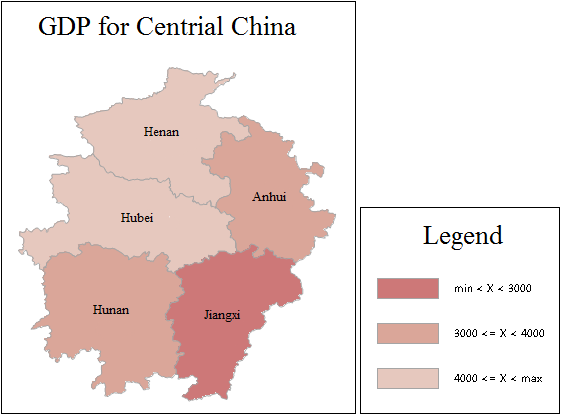
Click "Graudated Colors Map" "in the" Thematic Map "tab to directly generate the default Graudated Colors Map of the system, and the user can modify the Parameter Settings on this basis. Make Graudated Colors Map that meet the needs of cartography. The following figure shows a schematic of the Graudated Colors Map. Graudated Colors Map based on GDP data of Henan (5137), Hubei (3028), Hunan (4276), Jiangxi (2003) and Anhui (3691) in 2000. According to the distribution of GDP values, it is divided into three sections, minimum value ~ 3000, 3000 ~ 4000, 4000 ~ maximum value. Each segment is represented by a different color.
 |
It can be seen from the above figure that Jiangxi is located in the first segment (< 3000), Hubei and Anhui are located in the second segment (3000 ~ 4000), and Henan and Hunan are located in the third segment (> 4000).
Graudated Colors Map can be made based on any point, line or surface Vector Layer. When making a Graudated Colors Map, first set the Vector Layer Settings to be Create Thematic Map as the current layer, that is, select the Vector Layer in the Layer Manager. At the same time, the thematic map can be edited. For more information on thematic map editing, see the Edit the thematic map .
There are two ways to make Graudated Colors Map:
 Create a new Graudated Colors Map.


 Related topics