


Advanced tab
It is used to perform Advanced Settings on the statistical chart in the current Statistical Thematic Map. All settings in this tab will be reflected in the current statistics Thematic Label Map in real time, that is, WYSIWYG.
- Options area: This area is used to adjust and control the display of the chart in the Statistical Thematic Map.
- Flow: Select this check box, and the rendering style of the thematic map can be Flow Display, that is, the statistical chart will move with the change of Map to achieve the optimization effect of Show All. When the Flow effect is enabled, do not use the Partly Refresh function, otherwise the Partly Refresh effect will be displayed incorrectly (iDesktopX does not support the Partly Refresh function).
- No Overlap: Select this check box to automatically adjust the statistical charts on the map within a certain range, so that the statistical charts can be displayed simultaneously without overlapping and affecting each other.
- Show Negative: Select the check box to display the statistical chart corresponding to the object with the negative display attribute on the map.
- Statistical Scale Symbol: Select this check box to enlarge or reduce the scale of the statistical scale symbol with the scale of the map; otherwise, all the statistical scale symbols will be fixed to the Display Size according to the Parameter Settings in the dialog box, and will not change in size with the scale of the map.
- Show Leader Line: When the thematic map is offset from the object it represents, you can set a pull line to connect the two. If the "Flow" check box is checked, the "Show Leader Line" check box is selectable. Select the check box, and the "Line Style" button on the right is available. Click the button to set the style of the traction line in the pop-up "Symbol Library Management" window.
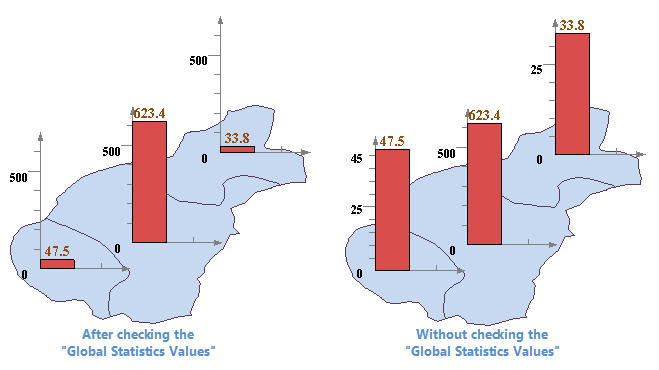
- Global Statistics Values: Select this check box. The current Statistical Thematic Map will judge all statistical values to determine the display scale of statistical value symbols. The statistical Marker Size is displayed according to the same display scale between statistical charts. As shown in the left figure below, the three statistical values show the height of the histogram according to the same coordinate scale. It is suitable for showing the contrast relationship between statistical values, and the proportional relationship between statistical values can be seen through the display of statistical symbols. If this check box is not
selected, the program will determine the display scale range according to the attribute value of the current statistical range, and there is no proportional relationship between the statistical values. In the right figure below, the three statistical value bar charts are not correlated with each other, and each shows the current statistical value independently.
- "Visible Size Range" Area: " Set the base value for the display of the Statistical Thematic Map statistics symbol, including the maximum base value and the minimum base value. The Display Size of all charts gradually changes between the maximum and minimum values. Application automatically calculates the appropriate maximum and minimum values. When "Scale with Map Zoom" is selected, the unit of the reference value is consistent with the map unit; when "Scale with Map Zoom" is not selected, the unit of the reference value is 0.01 mm.
- Start Expression: Check the "Start Expression" check box to control the size of the statistical symbol display through the field value, or directly enter the value to set the size of the statistical symbol in map units.
- Maximum Display Value: Sets the Display Size of the statistical symbol of the maximum statistical object. When the Themtic Type is Pie Chart, 3D Pie Chart, Rose Chart, 3D Rose Chart or Ring Chart, the diameter of the statistical chart is one fourth of the maximum display value. For example, if the maximum display value of the pie chart is set to 10000, the maximum diameter of the pie chart is one fourth of the maximum display value, that is, the diameter is 2500; Statistical Thematic Map of Other Type, such as column chart and area chart. The height value of statistical chart is 1/4 of the maximum display value. For example, if the maximum display value of column chart is set as 10000, the maximum height value of column chart is 1/4 of the maximum display value, that is, the height of column is 2500. Other statistical symbols, plotted to scale against the maximum and minimum statistical symbols.
- Minimum Display Value: Sets the Display Size of the statistical symbol of the minimum statistical object. When Themtic Type is Pie Chart, 3D Pie Chart, Rose Chart, 3D Rose Chart or Ring Chart, the diameter of the statistical chart shall be one fourth of the minimum display value; Other Type Statistical Thematic Map, such as column chart, area chart, etc. The height of the statistical chart is a quarter of the minimum display value. Other statistical symbols, plotted to scale against the maximum and minimum statistical symbols.
- "Offset Settings" Area: " Lets you set how much the anchor points of chart objects in the Statistical Thematic Map are offset from the interior points of the objects they label.
- Offset X: The text box to the right of this label is used to set the Offset X of the anchor point of the statistic chart object relative to the interior point of the object it represents. Click the Drop-down Button on the right side of the text box to select a numerical field as Offset X, or directly enter the value of Offset X: in the text box.
- Offset Y: The text box to the right of this tab is used to set the Offset Y of the anchor point of the statistic chart object relative to the interior point of the object it represents. Click the Drop-down Button on the right side of the text box to select a numerical field as Offset Y, or directly enter the value of Offset Y: in the text box.
- Offset unit: The Drop-down Button on the right side of the tab is used to set the unit of the offset value. Click the Drop-down Button, and in the pop-up drop-down menu, the system provides two offset units of "Unit" and "0.1mm" for the user to select. "0.1mm" indicates that the offset of the symbol is in the unit of 0.1mm; "Unit" indicates that the offset set is consistent with the unit of Map Coordinate System.
- "Graph Labels" Area: " You can set whether to display the text annotation on the statistical chart. To add Graph Labels, select the check box. The Markup Format combo box and the Label Style "button are available. You can set the Statistical Thematic Map text display format and the Text Annotation style.
- Marking format: The system provides five display formats for Statistical Thematic Map text: percentage, true value, title, title + percentage, and title + true value. The user can select the text format marked on the current statistical chart as required.
- Label Style: Sets the style of the annotation text on the current statistical chart. The user can click the button on the right side of the label to set the style of the statistical graph text annotation in the pop-up Text Style dialog box. For details, refer to Change the style of the Uniform Label thematic map .
- "Coordinate axis" area: Whether to show axis can be set. If it is displayed, the check box can be checked to add coordinates to the statistical chart and enrich the coordinate axis. The Axis check box is only available for area, ladder, line, dot, column, 3D Bar Chart, Stacked Bar, and 3D Stacked Bar Chart.
- Axis Color: Sets the Axis color of the current Statistical Thematic Map. Click the button on the right side of the tab to pop up the color panel, where you can select and set the appropriate Axis Color.
- Marking Mode: The Drop-down Button on the right of this tab is used to display and set the Display Mode of the current statistic chart coordinate axis marking. There are four Display Modes: No Display, X Axis Only, Y-Axis Only, and Show All. The default annotation mode is Show All.
- Label Style: The Text Style Settings button to the right of the label is used to set the Text Style of the axis annotation. Select the check box, and the button on the right is available. Click it to set the coordinate text style in the Text Style dialog box that pops up. For details, refer to Change the style of the Uniform Label thematic map .
- Axis Grid: This check box selects whether to Show Axis Grid.
- Bar Styles:
- Column Width Factor is used to set the width of each column in the histogram. The default value is half of the maximum width of the current histogram. The desired width of the histogram can be set in the spin box to the right of the label. The value can be between 0 and the maximum width, otherwise the setting is invalid. The unit is the same as the map. This tag only works on Histogram, 3D Bar Chart, Stacked Bar, 3D Stacked Bar Chart.
- Bar Spacing Factor: is used to set the spacing between bar charts.
- Rose and Pie Styles: Used to set the Start Angle of the rose and pie charts, as well as the angle of the rose.
- Start Angle: Set the start angle of the pie/rose chart. The default value is the horizontal positive direction. This tab only works for Pie Chart, 3D Pie Chart, Rose Chart, and 3D Rose Chart.
- Rose Angle: It is used to set the angle of the Rose Chart or 3D Rose Chart slice in the statistical chart. The default value is 0. When the angle is 0 or more than 360 degrees, the number of fields for creating the statistical chart is equally divided by 360 degrees.
- The Parameter Settings in the Statistical Thematic Map "window will be reflected to the corresponding thematic map layer in the current Map in real time, that is, WYSIWYG. You can also disable Enable Real-time Refresh by unchecking the Enable Instant Refresh "checkbox at the bottom of the dialog box. If the "Enable Instant Refresh" "check box is not checked, the user can click the" Apply "button at the bottom of the dialog box to apply the Parameter Settings in the dialog box to the current thematic map after completing the Parameter Settings.
 |
Remark
- The Statistical Thematic Map made and modified by the user can be saved as a template so as to be applied to the thematic map making of other layers. For details of Save as thematic map template, please refer to Save to Thematic Map Template Library .
- When Create Thematic Map in the Use Template mode, the user can directly select the saved template in the drop-down menu of the Template Drop-down Button to apply it to the production of other thematic maps.
 Related topics
 Modify Statistical Thematic Map.