


The Dot Density Map is similar to the Graudated Colors Map and the Graduated Symbols Map, which also maps a certain attribute Select Fields of the Vector Layer to different levels. Each level is represented by point symbols in the form of density. The density of point symbols distributed in the area is proportional to the Property Field value. The larger the attribute value is, the denser the distribution of point symbols on the thematic map is, and vice versa. In addition, Dot Density Map is the only thematic map in SuperMap that only supports the surface layer, and any other layer cannot create Dot Density Map. Dot Density Map is mostly used on maps with quantitative characteristics, such as the classification of grain production, GDP, population and so on in different regions.
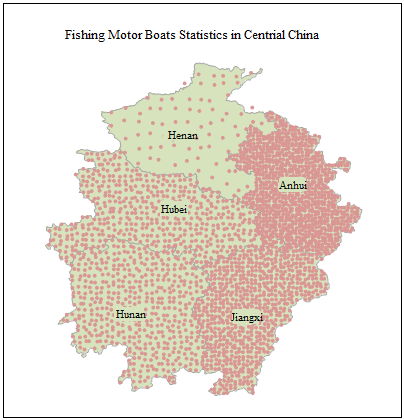
Click the "Dot Density Map" button in the " Thematic Map" tab to directly generate the Dot Density Map in the default style of the system. Users can also set various parameters through the Dot Density Map window to customize the Create a dot density map. The following figure shows the schematic diagram of the Dot Density Map, which is based on the map of the five provinces in central China. The Statistical Data of fishing motor vessel power in 2003 is expressed by Dot Density Map, and the reference value is 10,000 kilowatts. It can be seen from the figure that the density of dot symbols indicates the power of motor boats in the province. The power of motor boats in Anhui Province is the largest, followed by Jiangxi Province, Hubei Province and Hunan Province are basically equal, and the power of motor boats in Henan Province is the smallest.
 |
A Dot Density Map can be made based on a Vector Layer on either side. When making a Dot Density Map, first set the face vector Layer Settings to be Create Thematic Map as the current layer, that is, select the face layer in Layer Manager.
