Linear reference
Linear referencing is a method of describing and storing geographic locations using Relative along a linear feature with measured values. Distance measurements are used to locate events along the line, which can be attributes such as length, time, cost, etc. As a common dynamic positioning technology, linear reference technology is widely used in Data Collection of linear characteristics such as highways, railways, rivers, public transport system management, pavement quality management, communication and distribution network simulation (such as power grid, telephone lines, television cables, water supply and drainage pipes) and other fields.
In real life, people prefer to use linear reference technology for the following two reasons:
- In real life, we often use the way of positioning by the distance of elements along the line, which is more in line with people's habits than traditional way of precise (X, Y) coordinate positioning. For example, it is easier to locate a traffic accident 300 meters east of a certain intersection than to describe it as occurring at the coordinates of (6570.3876, 3589.6082).
- Linear references can be used to associate multiple attribute tables with linear features, eliminating the need for split line data when attribute values change.
As shown in the figure below, the gray line represents the mileage of the highway with the measured value, and the points and segments above the line represent the two types of events that occur on the segment. The description is as follows: Two traffic accidents occurred at km 12 and 84.3 of the highway respectively, while the road surface collapsed at km 35 to 76 along the highway due to heavy rain.
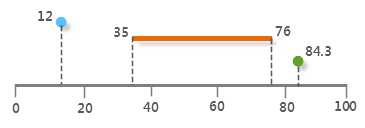 |
| Figure: Linear reference diagram |
Dynamic Segmentation
Dynamic Segmentation (Dynamic Segmentation) is not to segment the linear feature physically at the place where some attribute changes along the line, but to use linear reference technology on the basis of traditional GIS data model. The attribute and its corresponding linear element position are stored as an independent event attribute table (event table). When analyzing, displaying, querying and outputting, the linear element is dynamically and logically segmented directly according to the distance value in the event attribute table, and the spatial position of the attribute data is dynamically calculated.
Simply speaking, Dynamic Segmentation is the process of dynamically displaying linear reference elements on the map, and it is the application of linear reference technology. Without changing the original Spatial Data structure of the feature, it establishes the association relationship between any road section on the linear feature and multiple Attributes.
Basic concepts
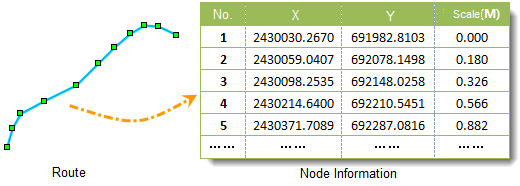
In SuperMap, Dynamic Segmentation mainly involves two data structures: routing and event table. A route is used to express a line object with measurements, and the event table records the location and other attributes of the phenomena that occur on the route.
- Route
A route is any linear feature with a Unique identifier ID and measurement system, which can be a linear feature such as a road, street, river, or pipeline. Each node on the route has a scale value (M value), which represents the distance from the current node to the starting point.
- Scale value
, also known as M value, refers to the scale value of a point on the route, indicating the distance between the point and the starting point. It is independent of the Feature Class's Coordinate System and is not required to have the same units as the Feature Class's Coordinate System.
- Route location
a route location is a "point" or a "line" on a route. The route position of the point is described by the identification field of the route where the point is located and a scale value (M value), and the route position of the line is described by the identification field of the route where the line segment is located, the start scale value (M value) and the end scale value (M value).
- Route Dataset
a Data Type that stores line type data. Each node of the line object has a scale value (M value) in addition to the GCS value, representing the distance from the node to the starting point. Route Dataset can be generated by the combination of line and point data on the line.
- Event
A series of point or line elements stored in the form of an attribute table and occurring in the routing system is called a routing event, which records the identifier of the route where the point or line is located, the corresponding M value, and the associated attributes. Routing events are called events for short. Generally, events are divided into two types: point events and line events. Events are stored in the event table.
- Point event
The point event corresponds to a precise location point on the route, such as the mileage point on the highway and the traffic accident point on the railway.
- Line Event
A line event corresponds to a segment on a route, such as a segment of a road in road maintenance.
- Zero Length Event
is a line event where the start and end ticks are the same.
- Event table
The event table contains information about the conditions and attributes of the events that occur and the events that occur along the route. These associated attributes are stored in a table to form a routing event table, or event table for short. Similarly, the event table can be divided into point event table and line event table according to different events.
- Interpolation to calculate M value
The interpolation method can be used to estimate the scale values of other nodes on the route through external data or the scale values known by LineM itself. Interpolation methods are divided into interpolation and extrapolation.
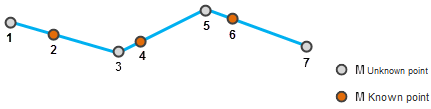
Interpolation is the estimation of values at intermediate points between known values of the series, while extrapolation is the estimation of values outside the range of known values of the series. As shown in the figure below, the M value of node 1 can be extrapolated forward from points 2 and 4, the M values of nodes 3 and 5 can be interpolated from points 2, 4 and 6, and the M value of node 7 can be extrapolated backward from points 4 and 6.