Instructions for use
The Ministry of Land and Resources has developed the Land Use data exchange format based on the national standard Geographic Spatial Data Exchange Format (GB/T17798-2007). Land Use data only describes Vector Data, and the suffix of the file is VCT, which is called VCT file for short. Through this file, the exchange of all kinds of land and resources Spatial Info can be realized. The VCT Vector Data exchange format is widely used in the collection of Land Use status survey results, the collection of Land Use planning results and the exchange of cadastral survey database results.
The VCT file consists of six parts: the first part is the file header, which describes the Basic Info of the data, such as Layer Bounds, coordinate dimension, scale, etc.; the second part is the element type parameter, which describes the layer elements contained in the data; the third part is the attribute data structure, which describes the attribute data structure corresponding to each layer element; The fourth part is the graphic data, describing the geometric data of each layer of feature object; the fifth part is the annotation, describing the data with text annotation; the sixth part is the topological data, describing the data of geometric Topology; the seventh part is the attribute data; the eighth part is the graphic representation data.
VCT file = file header + feature type parameter + attribute data structure + graphic data + annotation + topology data + attribute data + graphic presentation data
- The first part is the file header: the header file starts with HeadBegin and ends with HeadEnd, where Version: represents the version number of the VCT file, represented by 1.0, 2.0 and 3.0.
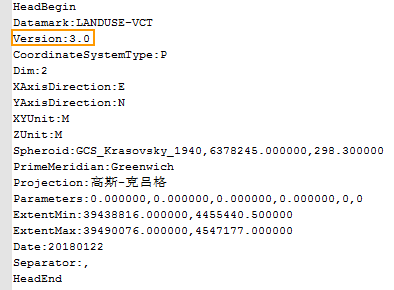
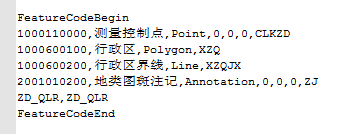
- The second part is the feature layer type parameter: Start with FeatureCodeBegin and end with FeatureCodeEnd. All three versions support the configuration of point, line, surface and annotation layers. VCT 3.0 supports pure attribute table configuration, while VCT 1.0 and VCT 2.0 do not.
- Point, line, surface and annotation are divided into four types. The first field: feature type code; the second field: feature type name; the third field: Layer type; the fourth field: name of Dataset in SuperMap.
- The pure table consists of two fields. Take the "ZD _ QLR" and "ZD _ QLR" "in the above figure as an example: the first field (ZD _ QLR): the table name of TableStructure. Field 2 (ZD _ QLR): Name of the Dataset in the SuperMap.
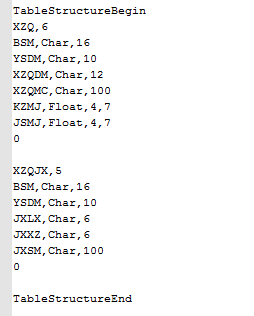
- The third part is the attribute data structure: describes the attribute data structure corresponding to each layer element. The attribute data structure begins with TableStructure Begin and ends with TableStructureEnd. The first field in the first line is the number of property items, such as (XZQ, 6), that is, there are 6 Property Fields in the administrative property table. The content of each Property Field, namely (property name, Type, width), starts from the second line.
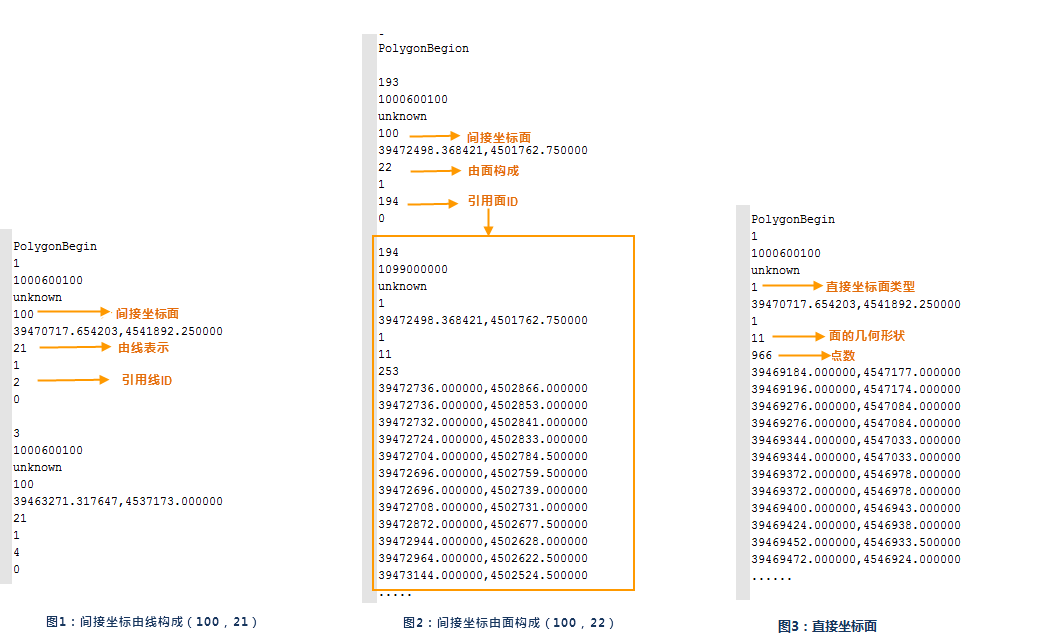
- The fourth part is the graphic data: the geometric graphic data describing the feature objects of each layer. The graphic data can be divided into dot graphic data, line graphic data, and area graphic data.
- The field in
- the first row is the identification code: each element takes the Object ID code as the starting mark, and the "identification code" of the three types of elements, namely, point, line and surface, cannot be repeated.
- The second row of fields is the element code: if it has been defined in the drawing data structure, it will be defined from it; if it has not been defined, "Unknow" will be displayed.
- The third line field is the layer name: if it has been defined in the graphic data structure, it will be defined from it; if it has not been defined, "Unknow" will be displayed.
- The fourth row of fields are the feature types of graphic elements: the feature types of points, lines and surfaces are different.
- The characteristic type of the
- point: 1 | 2 | 3, 1 represents an independent point, 2 represents a node, and 3 represents a directed point.
- Line feature type: 1 | 2 | 3 | 4 | 5 | 6 | 100, 1 for polyline, 2 for arc, 3 for circle, 4 for ellipse, 5 for smooth curve, 6 for B-Spline Curve, 100 for indirect coordinates. In the Land UseVector Data exchange format, line features are described in direct coordinates.
- linear graphic data has the number of object points, and the point coordinates are in the following order.
- Area graphic element description: different area feature types have different data expression forms. Facet feature types: 1 and 100, where 1 represents a face object represented by direct coordinates and 100 represents a face object represented by indirect coordinates. Composition type of indirect coordinate surface: 21 and 22, 21 represents indirect coordinate surface reference line represents surface object Figure 1, 22 represents indirect coordinate surface reference line represents surface object Figure 2. Direct Coordinate Plane uses the point coordinates of the polyline to directly represent the face object without reference, as shown in Figure 3.
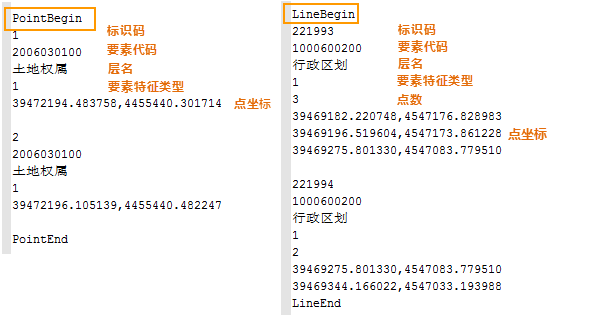
- The fifth part is the annotation element: start with AnnotationBegin, and end with AnnotationEnd. The mark is stored in the annotation data field. The first line is the Object ID code, the second line represents the element type code, the third line is the graphic representation code, and the fourth line is the characteristic type of the annotation. Feature types are denoted by 1 and 1, where 1 is a single-point annotation and 2 is a multi-point annotation.
- The sixth part is the attribute element: The attribute data section is stored in a centralized way with the AttributeBegin and AttributeEnd flags. The attribute data section can contain multiple attribute tables. Each attribute table starts with the attribute table name and ends with the TableEnd flag.
- The seventh part is the graphic presentation data: the graphic presentation data segment is set with the StyleBegin and RepresentationBegion as the start flags and the StyleEnd and RepresentationEnd as the end flags.
VCT Config File
provides export of point, line, surface, Text Dataset, attribute table as VCT file. The export of the three versions of the Config File is slightly different. Here is the description of the three versions of the Config File:
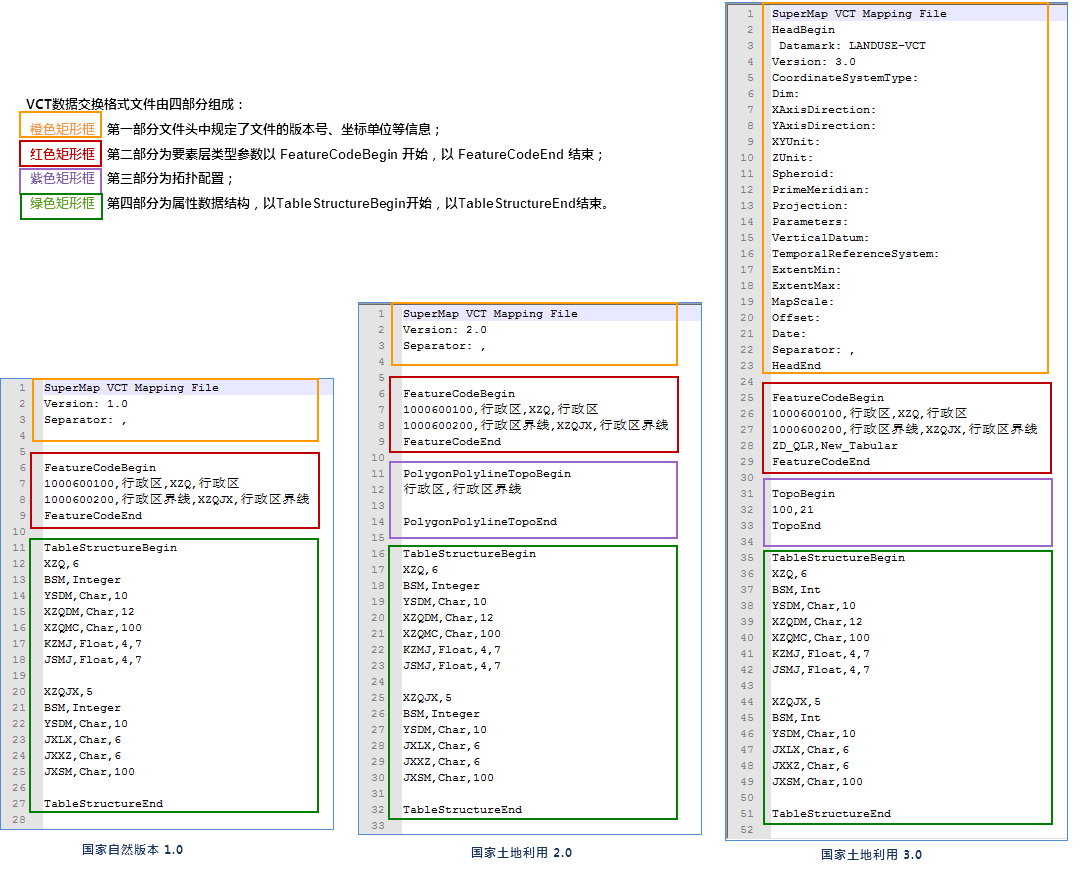 |
- The first part of the file header: The Config File of the three versions of VCT starts with the SuperMap VCT Mapping File, where VCT 1.0 is the same as VCT 2.0, and 1.0 and 2.0 are used to identify the versions. Header information configuration is added
in VCT3.0, in which Datamark must be configured with LANDUSE-VCT, Version must be configured with 3.0, and other configuration information can be configured optionally. If it is not configured, the original data shall prevail. If it is configured, the configuration shall prevail.
- The second part is the feature layer type: Start with FeatureCodeBegin and end with FeatureCodeEnd. Multiple feature layers can be configured. All three versions support the configuration of point, line, surface and annotation layers. VCT 3.0 supports pure attribute table configuration, while VCT 1.0 and VCT 2.0 do not.
- Point, line, surface and annotation support the configuration of four fields. Take "1000600100, XZQ, Administrative Region" in the figure above as an example: the first field (1000600100): code of element type in VCT; the second field (administrative region): name of element type in VCT; 3rd field (XZQ): Table name of TableStructure in VCT; 4th field (XZQ): Name of Dataset in SuperMap.
- The pure table supports the configuration of two fields. Take the ZD _ QLR and New _ Tabular "in the above figure as an example: the first field (ZD _ QLR): the table name of TableStructure in VCT. Field 2 (New _ Tabular): Name of Dataset in SuperMap
- The third part is Topology configuration:: configure the Topology between Region Dataset and Line Dataset. VCT version 1.0 does not support configuring Topology.
- VCT2.0 Topology Configuration: Start with PolygonPolylineTop oBegin and end with PolygonPolylineTop oBegin. Topology of multiple groups of data can be configured, as shown in the figure above. Take Administrative Bound Aries Annotation "as an example: Region Dataset and Line Dataset (Administrative Boundaries Annotation), where the first field (administrative region) is the name of the Region Dataset in the SuperMap; 2nd field (Administrative Boundaries Annotation): The name of the Line Dataset in the SuperMap.
- VCT3.0 Topology Configuration: Figure 1 is configured as Direct Coordinate Plane, which is of type 1 and has only one field. Fig. 2 and fig. 3 are configured as an indirect coordinate surface, the indirect coordinate surface is two fields, the indirect coordinate surface is a 100 type, 21 indicates that the indirect coordinate surface is composed of lines, and 22 indicates that the indirect coordinate surface is composed of planes.

- Table Structure Configuration: The configuration methods of the three versions are the same, starting with TableStructureBegin and ending with TableStructureEnd. The first line: the first field: the name of the Table Structure in VCT. Field 2: The number of fields in the table. It is followed by several lines of the table field: the first line must be the identification code line: BSM, Char, 16, and then it is optional, in the form of: field name, Type, width, precision. Among
- VCT3.0 Type: Char, Int, Float, Date, Time, Datetime, Varchar. Varbin, where Char needs to configure the width, Float needs to configure the width and precision, and others only need to configure the field name and type.
- VCT 2.0 Types include: Char, Integer, Float, Date, Time, Varbin, where Char and Integer need to configure the width, Float needs to configure the width and precision, and others only need to configure the field name and type.


