


The bin/Resource/Chart/Presentation/S52 folder under the root directory of the SuperMap iMaritimeEditor package organizes the files that control the display of chart objects. It includes three folders: ColorTable, LookupTable and SymbolLic. You can modify or define the color table and Marker Style in ColorTable and SymbolLic, and finally modify or add the display command in LookupTable to achieve the purpose of controlling the chart display.
Folder description
Folders that control chart display are described as follows:
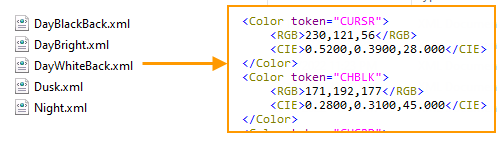
- ColorTable: The XML file in the folder defines the chart display color table, which corresponds to the color mode parameter in the Chart Properties Panel.
- Day Bright. XML is a daytime color chart;
- Dusk. XML is the color chart of dawn and dusk;
- Night. XML is the night color chart;
You can modify the RGB values in the file, or add the Color tag to expand the color. When you need to set the color in other files, you can directly call the token value.
- LookupTable: DIC file defines the display commands for complex point symbols, Simple point symbology, line symbols, Boundary Symbology face symbols, and simple Boundary Symbology face symbols. You can modify the or Add Symbol command in the corresponding file to expand the symbol display. The contents of each document are described below:
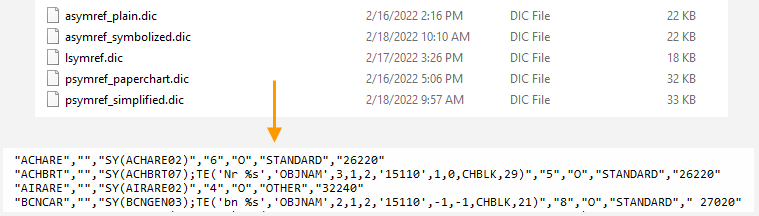
- The psymref _ paperchart. DIC records the display command of the complex point symbol;
- The psymref _ simplified. DIC records the Simple point symbology display command;
- The lsymref. DIC records the line symbol display command; Boundary Symbology display commands are recorded in the
- asymref _ symbolized. DIC.
- The asymref _ plain. DIC records the simple boundary surface symbol display command;
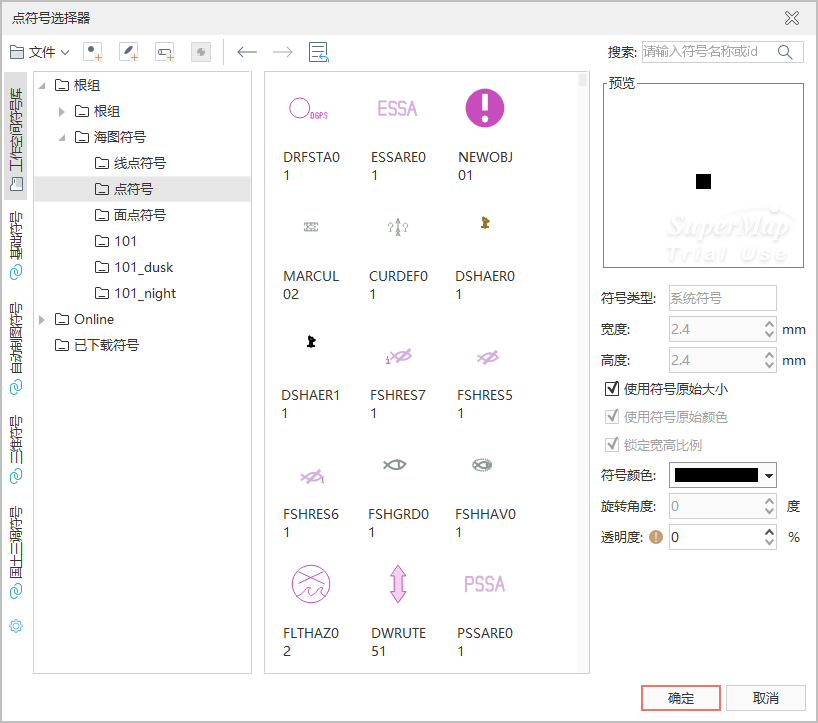
- SymbolLib: The file in the folder is the SuperMap point, line and surface symbol library, which records the symbols used in the chart. You can open the symbol library to preview symbols, or draw new chart symbols for symbol expansion. In the symbol editor, you can draw the symbol according to the ratio of width to height in the S-52 standard, and then set the Default Size of the symbol to the Marker Size required in the standard. The following figure shows the Marker Symbol Library:
Extended rule description
SuperMap iMaritimeEditor supports the object display of extended inland electronic waterway map and military map. Here, the object display of underwater/land pipeline in the extended inland electronic waterway map specification (CJ-57) is taken as an example. Details of the parameters in the commands "PIPSOL", "PRODCT3", "LC (PIPSOL06)", "6", "O", "OTHER", "34070":
| Is the abbreviation of the object, indicating submarine/land pipeline. | |
| PRODCT is the Object Property Field, 3 is the value. That is, when PRODCT = 3, the following style is displayed. Otherwise, the default style is used. When the double quotation mark here is empty, it means the default style. | |
Indicates that the display Symbol Name for the Line Dataset is PIPSOL06, which is the Symbol Name (available from the Resource symbol library ). The rules for displaying symbols for different Datasets are as follows:
|
|
| Indicates the priority of object display. | |
| Indicates whether it is related to radar. At present, it is O, which does not affect Display Effects. | |
| Base, Standard, OTHER: display category for the object. Corresponding to Display Type on Chart Properties Panel. For example, when the object is set to Standard and the Chart Properties Panel is set to Basic, the object will not be displayed in the map. | |
| The 34070 is viewing group. Similarly, objects are logically grouped without affecting Display Effects |
| The prefix that needs to be displayed in front of a field value is fixed Text Content, which is generally used in conjunction with the field immediately following it. For example, ( 'bn% s',' OBJNAM '), when the value of the OBJNAM field is Liu Jiawan, the text display content of this object is: bn Liu Jiawan. For numeric fields, such as ( '% 4.11 f kn', 'CURVEL'), it indicates that two decimal places are reserved for numeric field values, that is, the value of the CURVEL field of an object is 1245. 23450002, the displayed Text Content is: 1245.23 kn. % s,% 4.1lf is the escape character of C + + language. You can also see or use% 03.0lf,% f, etc. In the file. Please refer to C + + language for details. |
|
| Field, use as above. | |
Text Level Alignment:
|
|
Text Vertical Alignment:
|
|
The text interval can be set as 1, 2, or 3.
|
|
| The 15110 is viewing group, which is similar to the logical grouping of objects and does not affect Display Effects. | |
| Offset of the text in the X direction | |
| Offset of the text in the Y direction | |
| Text Color, the color value can be queried in the root directory bin/Resource/Chart/Presentation/S52/ColorTable folder. | |
| Indicates the priority of text display, which is not used inside the program at present. |
 Caution:
 - Since the display command extension is plain text editing, it is necessary to pay attention to the character writing format. Double quotation marks, commas and brackets must be English characters, and there must be no space between characters. When
- expanding, it is recommended to put it in the section one of the.dic file, and the content is in capital letters. You can find similar rules that have been defined for reference.
Related topics