


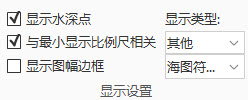
Function controls related to chart display are provided on the Nautical Chart Properties tab and in the Show Settings group on the Parameter panel. It includes display category, water depth color, color mode, Symbol Type, display font, Boundary Type, etc. It is used to set the Display Effects of the current chart.
 |
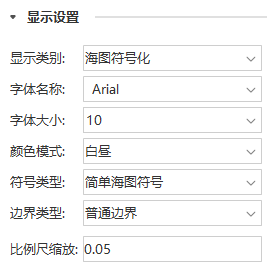 |
| Figure: Tab Show Settings Group | Figure: Properties Panel Show Settings Group |
Set Display Category
Display Category: The combo box on the right side of the label control is used to set the category of the current chart display. The user can click the Drop-down Button on the right side of the combo box and select to display Classify Name in the pop-up drop-down list. Currently, the display category supports S52 display and normal data display categories. S52 is the Electronic Chart content and display specification.
Settings Font
Font: The combo box on the right side of the label control is used to set the style of the font displayed in the chart.
Set Font Size
Font Size: The combo box on the right side of the label control is used to set the size of the font displayed in the chart.
Set Color Mode
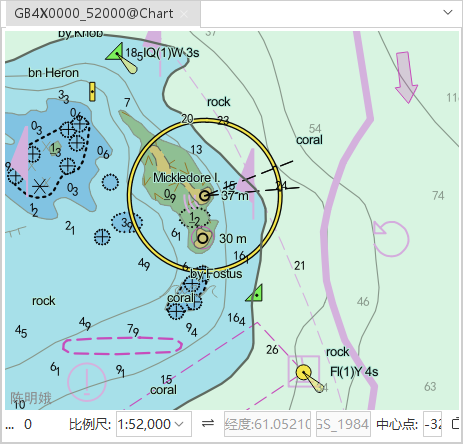
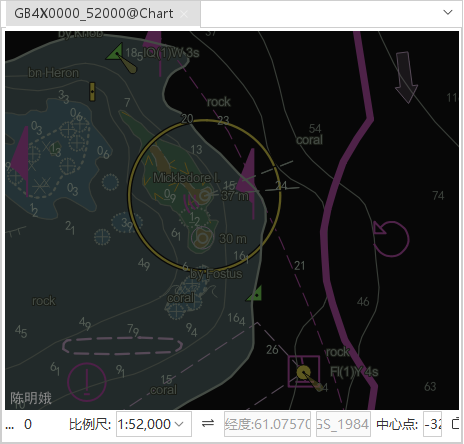
Color Mode: The combo box on the right side of the label control is used to set the color mode of the Chart Data set in the current Chart Window, so that the user can better distinguish the chart details under various lighting conditions without affecting the user's vision. The user can click the Drop-down Button on the right side of the combo box to select the chart color mode to be displayed in the pop-up drop-down list. The color mode is divided into Day, Dawn and Night. The Default Color Display Mode is Daylight.
 |
 |
 |
| Display Effects in Daytime Mode | Display Effects in twilight mode | Display Effects in Night Mode |
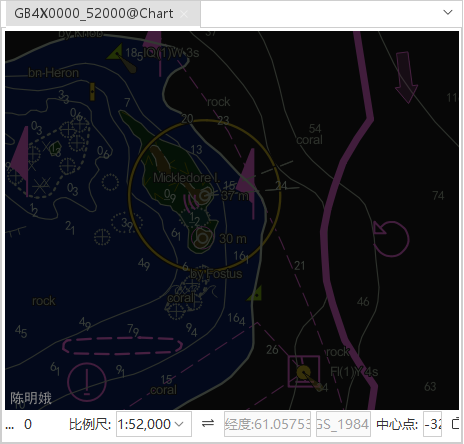
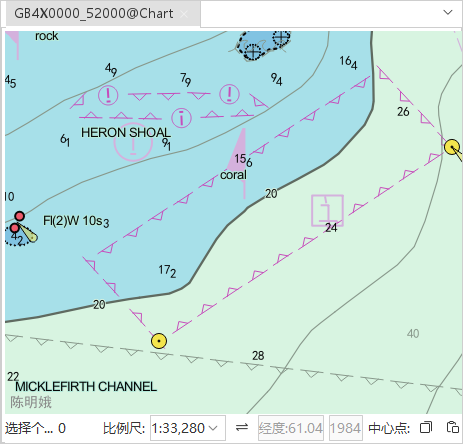
Set Symbol Type
Symbol Type: The combo box on the right side of the label control is used to set the display form of the object in the current Chart Window. The user can select the Symbol Type of the chart in the drop-down list by clicking the Drop-down Button on the right side of the combo box. Symbol Type is divided into Simplified Marker and Traditional Marker. If Simplified Marker is selected, the point symbol in the chart is displayed as a Simplified Marker. If Traditional Marker is selected, the point symbol in the chart is displayed as a Traditional Marker.
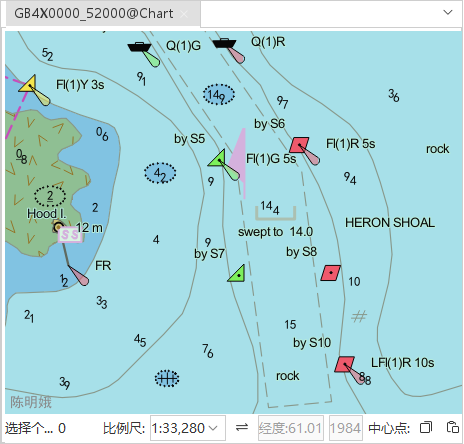 |
 |
| Display Effects for Simplified Marker | Traditional Marker's Display Effects |
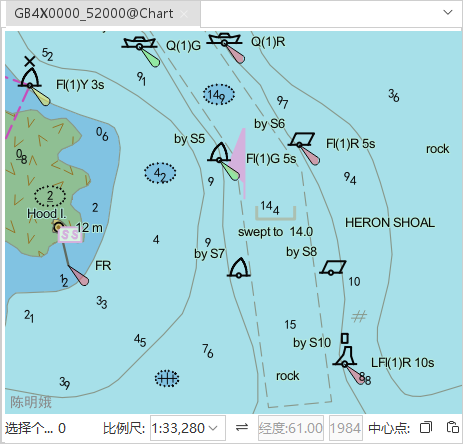
Set Boundary Type
Boundary Type: The combo box on the right side of the label control is used to set the display style of the area boundary in the current Chart Window. There are two types: Normal Boundary and Boundary Symbology. Normal Boundary means to use a normal area boundary, and Boundary Symbology means to use a symbolic area boundary.
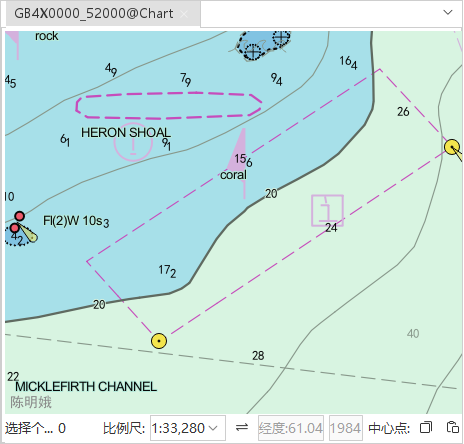 |
 |
| Display Effects for Normal Boundary | Display Effects for Boundary Symbology |