


Instructions for use
SuperMap provides S-52 Electronic Chart display style, IHO S-52 Electronic Chart content and display specification, IHO S-52 Electronic Chart content and display specification, It specifies the content and display, data structure, correction method and information transmission way of Electronic Chart, as well as the details of the use of Electronic Chart colors and symbols, which can improve the safety and effectiveness of navigation. Select Fields are displayed differently for each type of feature object according to the display standard of S-52. When creating a feature object, the appropriate symbol style and color are specified according to its type.
The operation of adding feature object in Chart Layer is basically the same as that in Normal Layer. However, each feature object can only be edited in the corresponding feature object Dataset. Therefore, if there is no object Dataset corresponding to the object element to be added in the Chart Group, the feature Dataset should be created or appended in the Chart Group first.
Operation steps
The user can refer to the existing scanning file or other base map to draw according to the feature type of the feature object. The geometric types of feature object elements are mainly point, line and surface, and the drawing methods are basically the same. The following is an example of drawing the "depth range" object surface object to describe the operation steps of adding feature object in detail:
- In Chart Data editing mode, right click the editable group and select Open in New Window to open the All Data set under the group in a new window. At the same time, open the base map data in the current Map.
- By default, the All Data Set layer is editable when the Editable Chart Group is turned on. In the Layer Manager ", select the Depth Range layer. On the Object Editing" tab, in the Object Drawing "group, Click the Polygon Drop-down Button and select Arbitrary Polygon ".
- Move the mouse to Map. When the mouse status is, you can start drawing according to the relevant chart data, and the Parameter Input box will display the coordinate value of the point in real time. Enter the coordinate value of a node of the polygon in the Parameter Input box (you can switch between the two Parameter Input boxes by pressing the Tab key), and then press the Enter key to determine the starting position of the polygon.
- Move the mouse again, determine the node position directly through the mouse according to the chart base data and related materials, or input the node coordinate value, Draw Polygon boundary line in turn, and click the right mouse button to close the polygon.
- After drawing an object, double-click the object, or select the object and right-click Properties to open the Properties dialog box. Select the Object Info "node in the dialog box, and enter the depth range of the object area in the Attribute Value of the DRVAL1 and DRVAI2 fields on the right, as shown in the following figure:
- Repeat the above steps, draw the depth ranges of other areas in turn, and assign corresponding attribute values. The display styles of different depth range values are different, and the final drawing results are shown in the following figure:
- In a similar manner, you can continue to add other types of object objects to improve the drawing of Chart Data.
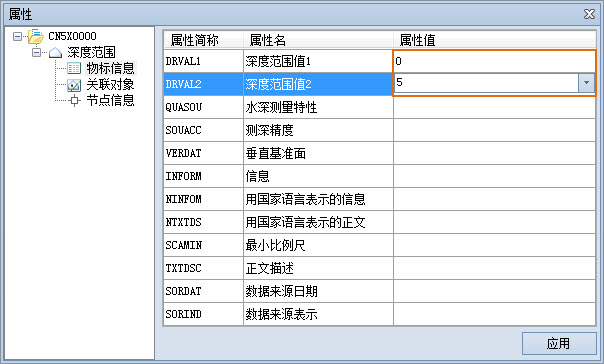 |
| Figure: Edit Object Properties |
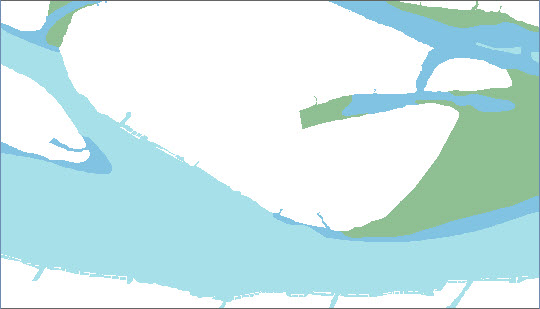 |
| Figure: Results of plotting the feature object |