


Create Editable Chart Group
Instructions for use
To produce a new chart, it is necessary to create a new editable chart Dataset Group. After successful creation, the corresponding Dataset Group contains no other data except the information entered during creation.
Operation steps
Take the creation of CN5X0000 Chart Dataset Group in Chart Datasource as an example to introduce the specific operation of creating Chart Group:
- In Workspace Manager, right click the Chart Datasource node and select Create Dataset..-> Editable Chart Group.. Or click the Chart tab-> Chart Data Management group-> Create New Group to pop up the Create Editable Chart Group dialog box. Set the following information in the dialog box:
- Datasource: Click the Drop-down Button on the right and select the Datasource stored in Chart Dataset Group.
- Data Standard: The default is S-57 (3.1), which is the version 3.1 released by IHO in November 2000 and is the currently valid S-57 standard. As required, the standard can be switched to CJ-57 (JTS 195-3-2019), namely the Technical Specification for Electronic Waterway Map of Inland Rivers issued by the Ministry of Transport in August 2019, with the standard code of JTS 195-3-2019.
- Feature ID Sequence: FIND is specified for the data packet. When the object is created, the corresponding FOID is also created and assigned to the object. Click the Drop-down Button on the right to select a feature identification sequence. If you do not Create Signature Sequence before Create Editable Chart Group, you can click the button in
 the dialog box to Create Signature Sequence.
 - Feature Identifier Distinguishing Number: FIDS, which is an important part of Feature Object Identifier (FOID). Here, you can assign a feature identification zone number to the created chart Dataset Group, and set it to 1. The value range is 1-65534.
- After completing Parameter Settings in the first step, click Next to set Layer Bounds. In the four text boxes of Left, Bottom, Right and Top, Input Data: the longitude and latitude of the upper left and lower right points of the range. For example, input: left: 120 °, bottom: 31.8 °. Right: 120.5 °, upper: 32 °.
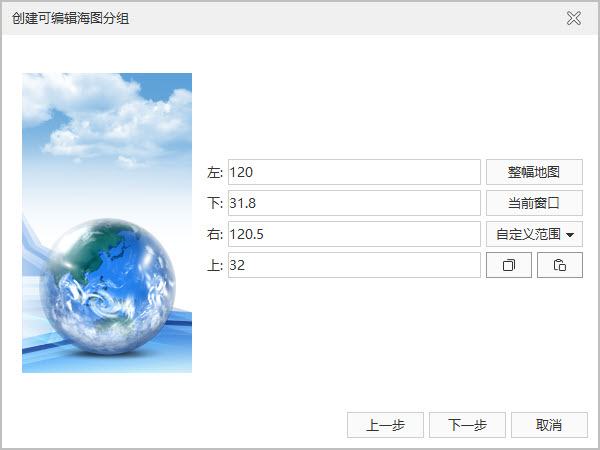
Create Editable Chart Group: Step 2 - After completing the Range Settings in the second step, click the Next button, and set the following parameters in the pop-up dialog box:
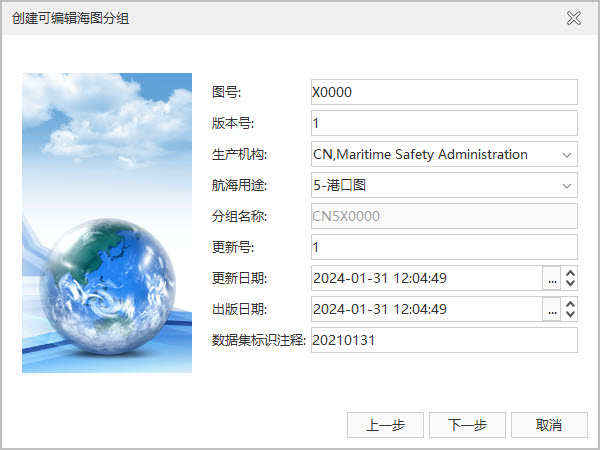
Create Editable Chart Group: Step 3 - Drawing No.: It is one of the important parts of Group Name, and can be set as five characters of ASCII code such as any letter or number. Set Drawing No. here as X0000.
- Version number: When an S-57 file (000 file) is initially generated, the version number is set to 1. The version number is increased by 1 for each new version. Set version number here to 1.
- Production organization: refers to the organization that produces the Chart Data. Specific production organization codes can be found in the IHO production organization code table, for example, the organization code of China Maritime Safety Supervision Bureau is CN.
- Navigation Purpose: The purpose and classification of Electronic Chart are determined according to the needs of ship navigation, channel maintenance and production. Electronic Chart under different standards has different classification of purpose types. The following are the classification and scale ranges under S-57 and CJ-57:
- Standard S-57 classifies Electronic Chart into six types of navigation purposes, and the specific classification and scale range are as follows:
Identification Nautical use Scale range Available Edit Scales (1:) 1 Summary ≤ 1: 1.5 million > 3 million, 1.5 million 2 General 1: 350,000 ~ 1: 1,490,000 700,000, 350,000 3 Coastal 1: 90,000 ~ 1: 349,000 180,000, 90,000 4 Entrance 1:22000 ~ 1: 89,000 45000、22000 5 Port 1:4000~1:21999 12000、8000、4000 6 Anchor > 1:4000 < 3999 -
CJ-57 inland electronic waterway map includes 10 navigation purposes such as water area overview map, waterway overview map and inland waterway map, and the specific division principles can be referred to the following table:
Outline map of ScaleIdentification Nautical use Scale range Available Edit Scales (1:) 1 Water area overview map 1:200thousand > 3 million, 1.5 million 2 navigation channel 1:50,000~1:200thousand 700,000, 350,000 3 Coastal 1: 90,000 ~ 1: 349,000 180,000, 90,000 4 Entrance 1:22000 ~ 1: 89,000 45000、22000 5 Port 1:4000~1:21999 12000、8000、4000 6 Anchor > 1:4000 < 3999 7 Inland Waterway Map 1:2000~1:50,000 8 Inland River Port Map 1:2000~1:10,000 9 Inland River Anchorage Map 1:1000~1:5000 A Superimposed graph adapted to the superimposed map
- Standard S-57 classifies Electronic Chart into six types of navigation purposes, and the specific classification and scale range are as follows:
- Group Name: used to display the file name of the S-57 file (000 file) corresponding to the chart. The name of the chart Dataset Group is composed of "Production Organization Code + Navigation Purpose + Chart Number". For example, the production organization code of "CN5X0000" is CN. Navigation purpose: 5-port, drawing No.: X0000.
- Update number: A new S-57 document (000 document) has an update number of 1. The first update associated with the new S-57 document has an update number of 2. The update number increases by 1 for each successive update, and can be modified according to the version number of the Electronic Chart to be produced.
- Update Date: An update to the S-57 document data must be made on or before this date. Click the Drop-down Button on the right and select Update Date in the date panel.
- Publication date: This is the date when the data producer made the data available. Click the Drop-down Button on the right and select to update the publication date in the date panel.
- Dataset Identification Note: Note information that can be identified in this Input Data: set. Only ASCII type characters can be input in this text box, such as letters, numbers, etc. For example, enter the Dataset Group creation date "20240131" as the note information.
- After completing the Parameter Settings in Step 3, click the Next button and proceed to Parameter Settings in the pop-up dialog box.
The description and settings of various parameters in the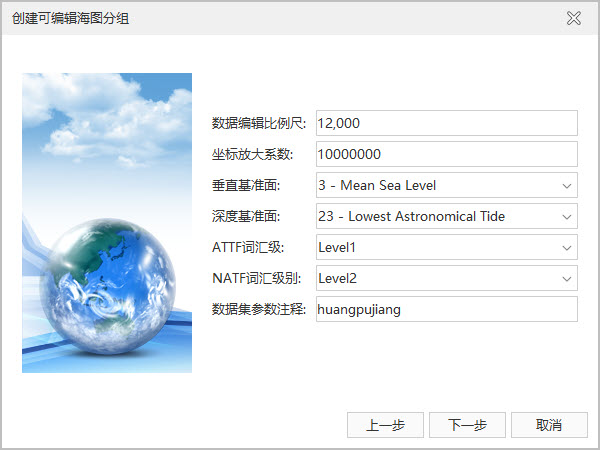
Create Editable Chart Group: Step 4 dialog box are as follows:
- Edit Data Scale: Denominator value of the scale used to create the Chart Data. If the navigation purpose set in step 3 is port, the usable scale of Edit Data is 1:12000, and the Edit Data scale is set to 12000.
- Coordinate magnification factor: refers to the multiplier factor that changes the coordinate value from floating point to integer. Press the default settings.
- Vertical Datum: refers to the starting surface of each elevation marked on the chart. The Application provides 31 selectable datum planes, which can be selected by the user according to the datum plane to which the current Chart Data belongs. Select "3-Mean Sea Level" datum "here.
- Depth Datum: refers to the starting surface of the water depth marked on the chart. The Application provides 31 selectable datum planes, which can be selected by the user according to the datum plane to which the current Chart Data belongs. Select 23-Lowest Astronomical Tide "datum here.
- ATTF Vocabulary Level: Refers to the character level used by the attribute value of the feature record Property Field (ATTF). The S-57 standard specifies that the ATTF vocabulary level should be Level 0 or Level 1. "Level 0 is ASCII text, and Level 1 is ISO 8859 Part 1, Latin Alphabet Series 1. The Level 1 character set is intended for use on virtually all computer systems.". Click the Drop-down Button on the right and select Level1.
- NATF Vocabulary Level: Refers to the character level used for the attribute value of the Feature Record Country Property Field (NATF). The S-57 standard stipulates that NATF vocabulary level can use three vocabulary levels: 0, 1 and 2. Levels 0 and 1 are consistent with the definition of ATTF. Level 2 is the universal character set, which includes almost all languages, including Latin characters, Greek, Chinese, Japanese, etc. Click the Drop-down Button on the right and select Level 2.
- Dataset parameter comment: Input data: comment information of set parameters here. Only ASCII characters, i.e. letters and numbers, can be input in this text box. For example, the place name of the input Chart Data is parameter comment information: huangpujiang.
- After completing the Parameter Settings in Step 4, click the Next button. In the pop-up dialog box, you can browse all the parameters set for the Dataset Group in the previous four steps.
- Click the Finish button to complete the creation of an editable chart named CN5X0000 Dataset Group, in which the datasets corresponding to the three necessary meta objects (M _ COVR, M _ NSYS, and M _ QUAL) of ENCElectronic Chart will be created by default. They are coverage, navigation marks and data quality.