


Instructions for use
Grid graph is simply a method of using spatial aggregation to represent the distribution and statistical characteristics of Spatial Data. Its basic principle is based on a grid aggregation algorithm, which divides a spatial region into grid cells with regular shapes, and each grid cell is divided into a plurality of levels, and the grid cells at a high level are divided into a plurality of grid cells at a low level, and each grid cell has Statistic Infomation.
SuperMap supports the construction of Grid Aggregation Map for spatial point data, and provides two shapes of mesh for Aggregation Display, one is rectangular mesh, and the other is Hexagonal Mesh. The map point elements are meshed through the grid, and then the number of the point elements in each grid unit is calculated and used as the statistical value of the grid, or the weight information of the points is introduced, and the weighted value of the points in the grid unit is considered as the statistical value of the grid; And finally, based on the statistical values of the grid units, carrying out color filling on the grid units through the color band according to the result of the sorting of the statistical values.
A complete Grid Aggregation Map contains the following elements:
- Grid: Each grid cell is a grid of the same size, which can be quadrilateral or hexagonal, and the size of the grid cell is fixed with the change of Map Scale; the grid is used to count the point Records falling into each grid cell.
- Label: Each grid center has a label, which is the statistical value of the grid cell. The statistical value can be the Records of the points falling into each grid cell, or the weighted value of the points falling into each grid cell.
- Mesh Rendering Style: The Fill Color of the mesh cell indicates the distribution trend of the mesh statistical value. The color is from dark to light, indicating that the value of the mesh cell is from large to small. In addition, you can set the style of the grid rectangle border.
Function entrance
Select the point data layer to be meshed in Layer Manager:
- On the Thematic Map tab-> Aggregate Map group-> click the Grid Map button.
- Right click and select Create Thematic Map.. in the pop-up Context Menu. In the pop-up Create Thematic Map dialog box, select Aggregate Graph-> Grid Graph.
Operation steps
- A grid map thematic layer is generated in Layer Manager.
- Select a grid map layer, and right click the Modify Thematic Map command to display the setting information of the current grid map in the pop-up Layer Properties panel.
- You can adjust the Display Effects of the grid map through some Set Parameters, including General Properties settings such as Display Control and Change Dataset of the grid layer.
- Display Control: Set layer visibility, Layer Name, Layer Caption, transparency, and maximum and Minimum Visible Scale respectively.
- Visibility: In the Layer Properties panel, you can Uniform SettingsLayer Group the visibility of All Layers in. If the Displayable check box is selected, All Layers under the selected Layer Group will be visible; if the Displayable check box is not selected, All Layers under the selected Layer Group will not be visible.
- Layer Name: used to display the name of the selected Layer Group. The name of the Layer Group cannot be modified. The name of the Layer Group is the Unique identifier of the Layer Group in the map where the group is located.
- Layer Caption: The text box on the right is used to display the title of the selected Layer Group. You can modify the title of a Layer Group. After modification, the Show Name of the Layer Group in the Layer Manager changes, but the name of the Layer Group does not change.
- Transparency: The spin box and Drop-down Button on the right can set the transparency of the current layer. Users can enter the transparency value directly, or click the Drop-down Button on the right side of the tab to adjust the transparency using the slider, and browse the setting results in real time. The default transparency value is 0, which means the layer is completely opaque. As the value increases, the layer becomes more transparent. When the transparency value is set to 100, the layer is completely transparent. The transparency value is an integer between 0 and 100.
- Minimum Visible Scale: The combo box is used to set the Minimum Visible Scale of All Layers in the Layer Group. After a layer Group Settings Minimum Visible Scale, if the map's scale bar is smaller than Minimum Visible Scale of the layer's Group Settings, All Layers in the Layer Group will not be visible. You can use the spin box to the right of Minimum Visible Scale to enter a scale value, such as 1:500000, or Current MapScale Settings to Minimum Visible Scale. You can also click the Drop-down Button on the right and select Scale Settings as the Minimum Visible Scale. The drop-down options are 8 scales from the default 1:5000 to 1:1000000; If Fixed Scales is set for the map, the optional scale of the drop-down item is the fixed scale.
- Maximum Visible Scale: The combo box is used to set the Maximum Visible Scale of All Layers in the Layer Group. After a layer Group Settings Maximum Visible Scale, if the map scale is larger than Maximum Visible Scale of the layer's Group Settings, All Layers in the Layer Group will not be visible. You can use the spin box to the right of Maximum Visible Scale to enter a scale value, such as 1:500000, or Current MapScale Settings to Maximum Visible Scale. You can also click the Drop-down Button on the right to select a Scale Settings as the Maximum Visible Scale. The drop-down options include 8 scales from the default 1:5000 to 1:1000000; If Fixed Scales is set for the map, the optional scale of the drop-down item is the fixed scale.
- Change Dataset: Click the drop-down arrows to the right of Datasource and Dataset respectively, and select the Dataset to be referenced and the Datasource where the Dataset is located. See: Change Dataset for more information .
- Parameter Settings: You can set parameters such as the grid field, grid type, Color Scheme, and Border Style of the grid layer.
- Grid Field: The grid field may not be specified. In this case, the statistical value of each grid cell in the grid map is the point Records in the cell by default. If a grid field is specified, the field value will be used as the weight information of the point. In this case, the statistical value of each grid cell in the grid map is the weighted value of the point in the cell. Additionally, that specify grid field must be a numeric field.
- Display Precision: Support the setting of the display precision of the grid statistical value. When the grid field is of double precision type, it is convenient to adjust the aesthetics of the label in the map. For example, if the grid value is 178.3129 and the display precision is set to 0.1, the grid value in the map will be 178.3; if the display precision is set to 0.001, the grid value in the map will be 178.312.
- Aggregate: When the grid field is specified, the point aggregation method of the Field can be specified. The program provides five aggregates, namely: average value, number, maximum value, minimum value and sum.
- Mesh Type: SuperMap provides two types of meshes for Aggregation Display, one is Quadrilateral Mesh and the other is Hexagonal Mesh. Select the appropriate grid type for your mapping needs.
- Side Length: This attribute is used to set the side length of the grid in pixels.
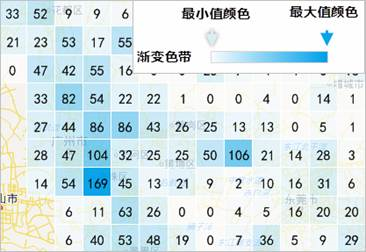
- Set Rendering Color Band: The color schemes provided by the system are listed in the drop-down list of the Color Scheme combo box. Select the required color scheme. The system will render the thematic wind corresponding to each field value according to the selected Color SchemeAutomatic Allocation.
- Minimum Color Transparency is used to render the transparency of the minimum grid cell in the grid map.
- Maximum Color Transparency is used to render the transparency of the maximum mesh cell in the mesh map.
- Color mode: Support the user to select the color mode to be displayed, including HSB and RGB.
- Original Point Visible Scale: Set the visible scale range of the generated grid map Point Dataset layer. Click the combo box Drop-down Button, and the program provides 10 types of scales. They are: 1:5000, 1:10000, 1:25000, 1:50000, 1:100000, 1:250000, 1:500000, 1:1000000, current scale, and System Default Scale. The user can also customize the input scale. It is convenient for the user to set the visible scale range of the original point according to the mapping requirements.
- System Default Scale: The program will calculate a scale according to the current grid map as the visible scale of the original point. Raw points smaller than System Scale are not visible. Raw points larger than System Scale are visible.
- Set to Current Scale: Set the scale of the current Map as the visible scale range of the Point Dataset layer. The original point smaller than current scale is invisible, and the original point larger than current scale is visible.
- Grid Label: The Grid Label of the Grid Aggregation Map mainly includes the following aspects:
- Show Lable: If the check box is checked, the grid aggregation value label is visible in the grid. If this check box is not checked, the grid aggregate value label is not visible in the grid. Click the button to the right of the text box to set the Label Style of the displayed grid aggregation values, including font, color, Font Effects, and so on. Changing the label text size is not supported here.
- Border Style: You can set the Border Style of the grid, and set the line type of the rectangular border line of the grid unit. There are three cases: no border, solid line border and dotted line border. Set the border line width. Set the Border Line Color and support the Translucent Effect Settings.
- A grid diagram based on Point Dataset is completed through the above Parameter Settings.
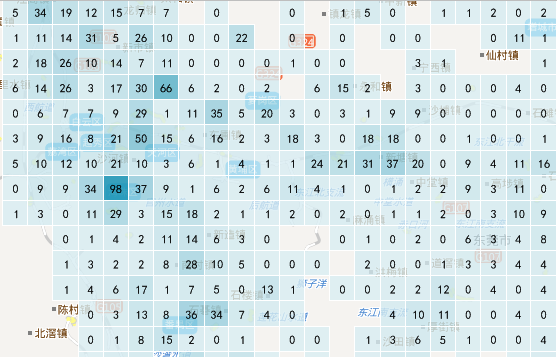 | 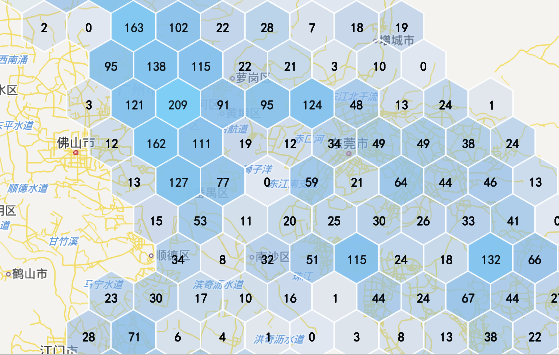 |
| Figure: Quadrilateral grid | Figure: Hexagonal grid |
 |
Application example
The grid map uses the spatial aggregation method to show the distribution characteristics and statistical characteristics of Spatial Data. Compared with the thermal map, it has the advantage of quantifying the distribution of geographical elements. The following figure shows the distribution of tourist attractions in Zhejiang Province based on the point data of the distribution of tourist attractions in Zhejiang Province.
Data Path SuperMap Sample Data SampleData-> AggregationMap-> GridAggregationMap
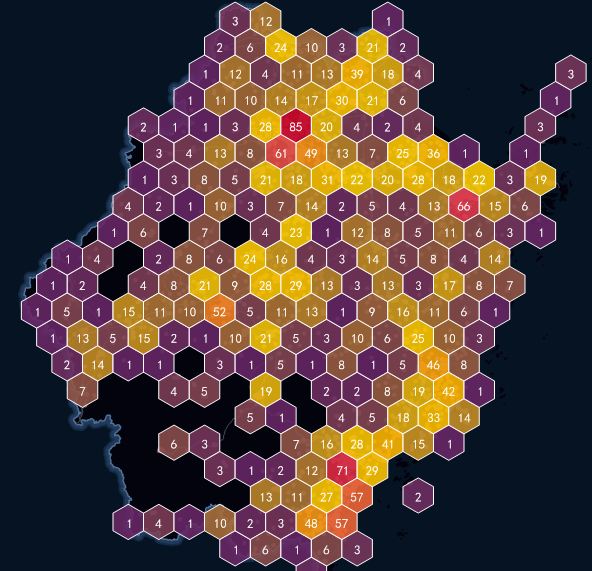 |
| Grid Map of Tourist Attractions in Zhejiang Province |