


Instructions for use
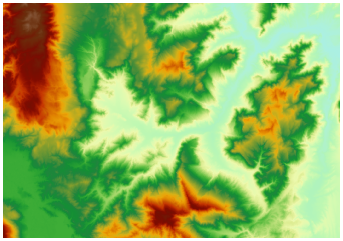
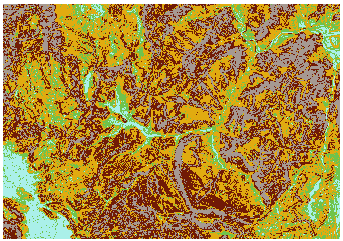
Zonal Statistics is to perform statistics on another Dataset (value data, which must be Raster Data) according to the area range (Zonal Data, vector data or Raster Data) of different categories contained in one Dataset. Without considering the adjacent relationship of grid pixels, the Raster Data is divided according to the region, the Raster Data in the same region is counted, the grid pixels in the same region are assigned to the same value for output, and finally a new Raster Dataset is obtained. For example, you can use Zonal Statistics to calculate the average population density within each contaminated section, the vegetation type at the same elevation, and the Land Use type within each area of the same slope. The following is the slope classification of a certain area. Raster Data is Zonal Data and Elevation Data is value data. Calculate the average value of elevation in the same slope area.
 |
 |
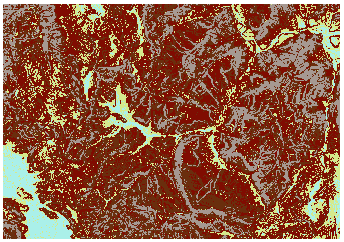 |
| Value data (dem data) | Zonal Data | Average Statistics Result |
The SuperMap Application provides 10 statistical modes, including:
- Min: Find the minimum value of the grid pixel value in the area.
- Max: Find the maximum value of the grid pixel value in the area.
- Average value: calculate the average value of all grid pixel values in the area.
- Standard deviation: calculate the standard deviation of all grid pixel values in the area.
- And: Calculate the sum of grid pixel values in the area.
- Type: count the number of grid pixel values in the area.
- Range: calculate the range of grid pixel values in the area, that is, the maximum value minus the minimum value in the area.
- Mode: The value of the grid pixel value Highest Frequency in the statistical area.
- Minimum: refers to the value with the lowest frequency of grid pixel value in the statistical area.
- Median: The value in the middle of the grid pixel values in the area arranged in the order from small to large.
When the Ignore No Value option is used, Zonal Data with no value is not counted. As shown in the figure below, for two grids, the Zonal Statistics mode is the maximum value. The processing setting for no-value data is Ignore No Value. As you can see from this example, the no-value data in the value Dataset is ignored, while the no-value data in the Zonal Data is considered.
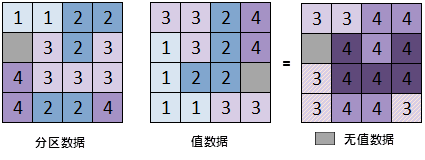 |
| Figure: Zonal Statistics "Diagram |
Function entrance
- Spatial Analysis tab-> Raster Analysis group-> Raster Statistics-> Zonal Statistics.
- Toolbox-> Raster Analysis-> Raster Statistics-> Zonal Statistics. (iDesktopX)
Parameter Description
- Value Data: Select the value data (Raster Data) to be counted, including Datasource and Dataset where Raster Data is located.
- Zonal Data: select the Zonal Data to be counted. Zonal Data can be Vector Region Dataset or Raster Dataset. Currently, only Raster Dataset with Pixel format of 1-bit (UBit1), 4-bit (UBit4), single-byte (UBit8) and double-byte (Bit16) is supported for Zonal Statistics.
- Identification field: The field used to identify the area in the vector Area Dataset. Type only supports Int. By default, the SMID of the Vector Dataset is used for statistics. Cannot identify a field to a Raster Dataset Settings.
- Statistical Mode: Select the statistical mode to be used. There are 10 types available. Include minimum, maximum, mean, standard deviation, sum, category, range, mode, minimum, and median.
- Ignore No Value: when Ignore No Value is selected, only pixels with values in Raster Data will be counted; otherwise, pixels without values will be counted.
- Result Data: Set Result Data. The results of Zonal Statistics are output as a Raster Dataset. You need to set the Datasource of the Result Data to be saved, as well as the name of the Raster Data and the property sheet name. Note that the names of the grid Result Data and the property sheet cannot be the same.
 Remark
Description of Statistics Result:
Grid Result Dataset: Grids of different colors represent an area, and the result of this area is directly assigned to all grid values in this area. For example, when performing Zonal Statistics, the selected statistical mode is the mean value, and the grid value of the Result Raster Dataset represents the mean value of all grid pixel values in this area.
Tabular Dataset: Statistics Result of this area is saved according to Statistic Field. The attribute table contains the results of all statistical modes (maximum value, minimum value, mean value, standard deviation, etc.) And the number of pixels (PixelCount) in the region, which is convenient for users to view uniformly.