


Instructions for use
Neighborhood Statistics is to count the pixels within the neighborhood range of each pixel value in the Dataset, that is, take the grid to be calculated as the center, extend to a certain range around it, perform statistical calculation based on the Raster Data within these neighborhood ranges, and take the calculation result as the value of the pixel. The statistical methods currently provided include: maximum value, minimum value, mode, minimum number, etc. Common neighborhood range types include rectangle, circle, ring, and sector.
The figure below is a schematic diagram of Neighborhood Statistics. In the figure, the value of the cell in the second row and the third column is determined by all the pixel values in the neighborhood of 3 * 3 (rectangular neighborhood) obtained by spreading around it.
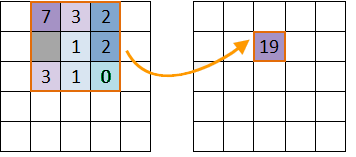 |
| Figure: Neighbor hood Statistics diagram |
- Statistical Model
The SuperMap Neighborhood Statistics provides 10 statistical models, as follows:
- Min: Find the minimum value of the grid pixel value in the area.
- Max: Find the maximum value of the grid pixel value in the area.
- Average value: calculate the average value of all grid pixel values in the area.
- Standard deviation: calculate the standard deviation of all grid pixel values in the area.
- and: Calculate the sum of grid pixel values in the area.
- Type: count the number of grid pixel values in the area.
- Range: calculate the range of grid pixel values in the area, that is, the maximum value minus the minimum value in the area.
- Mode: The value of the grid pixel value Highest Frequency in the statistical area.
- Minimum: refers to the value with the lowest frequency of grid pixel value in the statistical area.
- Median: The value in the middle of the grid pixel values in the area arranged in the order from small to large.
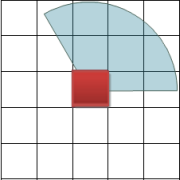
- Neighborhood Shape Type In the process
of Neighborhood Statistics, there are different ways to set the neighborhood. Four kinds of neighborhood windows are provided, as follows:
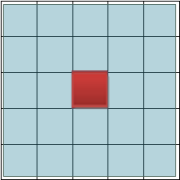
- Rectangle: The size of the rectangle is determined by the specified width and height. The pixels within the rectangle participate in the calculation of Neighborhood Statistics. The default values for rectangular neighborhood width and height are 0 (in geographic or grid units).
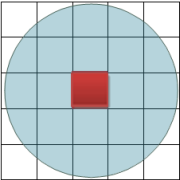
- Circle: The size of the circular neighborhood is determined according to the specified radius, and all pixels within the circular range participate in the neighborhood processing (Note: as long as part of the pixel is included in the circular range, it will participate in the Neighborhood Statistics). The default radius for a circular neighborhood is 3 (in geographic or grid units).
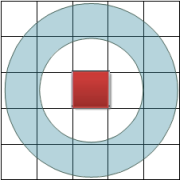
- Ring: The size of the ring neighborhood is determined according to the specified radius of the outer circle and the radius of the inner circle, and the pixels in the ring area are involved in the neighborhood processing. The default outer and inner radii for circular neighborhoods are 3 and 6, respectively (in geographic or grid units).
- Fan: The size of the fan neighborhood is determined according to the specified circle radius, Start Angle, and End Angle. All pixels in the sector are involved in the neighborhood processing. The default radius of the sector neighborhood is 3 (in geographic or grid units), and the default Start Angle and End Angle are 0 degrees and 360 degrees, respectively. The
four shapes are shown in the following figure, and the default neighborhood size is 3 * 3. The cells on the diagram are for illustration only.
Function entrance
- Spatial Analysis tab-> Raster Analysis group-> Raster Statistics-> Neigh borhood Statistics.
- Toolbox, Raster Analysis, Raster Statistics, Neighbor hood Statistics. (iDesktopX)
Parameter Description
- Source Data: Select the source data (Raster Data) for statistics, including the Datasource and Dataset where the Raster Data is located.
- Parameter Settings: Set parameters of Neighborhood Statistics, including statistical mode, unit type, and neighborhood shape.
- Statistical Mode: Select the statistical mode to be used. There are 10 types available. Include minimum, maximum, mean, standard deviation, sum, category, range, mode, minimum, and median.
- Unit Type: Select the unit type used for statistics. Currently supports 2 types of units, including number of rows and columns and Unit. The number of rows and columns refers to using the number of rows and columns of the grid as the neighborhood unit; Unit refers to using the length unit of the map as the neighborhood unit.
- Neighborhood shape: Select the shape of Neighborhood Statistics. Four neighborhood shapes are currently supported, including rectangle, circle, donut, and sector. After selecting the shape to be used, you also need to set the size of the specific shape. For example, for a rectangle, you need to set the width and height of the rectangle; for a sector, you need to set the radius, Start Angle, and End Angle of the sector.
- Ignore No Value: when Ignore No Value is selected, only pixels with values in Raster Data will be counted; otherwise, pixels without values will be counted.
- Result Data: The Datasource to save the Neighbour Statistic Result data and the name of Raster Data need to be set.