


Instructions for use
The Solar Radiation Analysis feature maps and analyzes the impact of the sun on a geographic area over a specific time period. Obtain grid maps of total solar radiation, direct solar radiation, scattered solar radiation, and duration of direct radiation in the analysis area. This will take into account atmospheric effects, the latitude and elevation of the site, slope, aspect, diurnal and seasonal variations in the angle of the sun, and shadows cast by the surrounding terrain.
On the landscape scale, topography is an important factor in determining the spatial variability of sunshine. Differences in elevation, direction (slope and aspect), and shadows cast by topographic features at different locations can affect the amount of sunlight received. The differences will also vary with the time of day and the year, resulting in differences in climate, including air and soil temperature conditions, evaporation, snow melt patterns, soil moisture and light available for photosynthesis.
When the incident Solar Radiation passes through the atmosphere, it will undergo direct, scattering, reflection, etc., and then due to further changes in terrain and surface elements, it will be intercepted into direct, scattering and reflection parts on the earth's surface. Direct radiation is derived from unobstructed direct rays of sunlight; diffuse radiation results from being dispersed by elements of the atmosphere such as clouds and dust; and reflected radiation is reflected by surface elements. The sum of direct, scattered, and reflected radiation is called Solar Radiation Total.
Solar Radiation Analysis is useful for understanding the amount of sunlight in a particular geographic location for applications in a variety of fields, such as agriculture, resource management, meteorology, civil engineering, and ecological studies. Specific applications are as follows:
- The amount of sunshine received by a certain area in a certain period of time is helpful for the location of new ski resorts, and also for the selection of the best planting location for special crops that need special microclimatic conditions to achieve the best growth state.
- In urban planning, the total solar radiation can be used as an important factor in the analysis of site suitability.
- Analyze the amount of direct radiation, scattered radiation and direct radiation duration in a specified time period in a certain area, and comprehensively consider these factors, so as to determine the most suitable location for planting apples (or other crops) in this area.
Function entrance
- Spatial Analysis tab-> Raster Analysis group-> Solar Radiation.
- Toolbox-> Raster Analysis-> Solar Radiation. (iDesktopX)
Parameter Description
- Terrain Data: Select the Datasource where the DEM Dataset for Solar Radiation Analysis is located and its DEM Dataset.
- Analysis Type: Solar Radiation Analysis supports the analysis of solar radiation within a period of time or a day. Annual Radiation Analysis and Day Radiation Analysis.
- Annual Radiation Analysis: Click to select the "Annual Radiation Analysis" radio box to analyze the Solar Radiation within the specified time period in a year. You can set the start time, end time, and sampling interval. Note: Annual Radiation Analysis is independent of the year. When setting the start time and end time, you only need to select the month and date, regardless of the year.
- Start Time: You can directly enter the month and date in the text box on the right, or click the Drop-down Button to select the start date of the analysis.
- End Time: You can enter the month and date directly in the text box on the right, or click the Drop-down Button to select the end date of the analysis. Note: If the start time is greater than end time, the time calculation will be carried forward to the next year.
- Sampling interval (day): It is used to set the number of days of sampling interval. The default value is 14 days, that is, the Solar Radiation of the area is calculated every 14 days.
- Sampling interval (hour): It is used to set the number of hours of the sampling interval. The default value is 1 hour, that is, the Solar Radiation of the area is calculated every 1 hour.
- Day Radiation Analysis: Click to select the "Day Radiation Analysis" radio box, and directly enter the specific month and date in the text box on the right, or click the Drop-down Button to select the date. You can analyze Solar Radiation for a specified period of time on a given day, and you can set the start time, end time, and sampling interval.
- Start time: You can enter the hour and minute directly in the text box on the right, or set it through the button on the right. The default start time is 00:00.
- End time: You can enter the hour and minute directly in the text box on the right, or set it through the button on the right. The default end time is 23:59. Note: The end time must be greater than start time, and analysis will not be performed across days.
- Sampling interval (hour): It is used to set the number of hours of sampling interval. The default value is 0.5 hour, that is, the Solar Radiation of the area is calculated every 0.5 hour.
- Annual Radiation Analysis: Click to select the "Annual Radiation Analysis" radio box to analyze the Solar Radiation within the specified time period in a year. You can set the start time, end time, and sampling interval. Note: Annual Radiation Analysis is independent of the year. When setting the start time and end time, you only need to select the month and date, regardless of the year.
- Two important parameters required for Solar Radiation Analysis can be set at " Radiation Parameter", namely, area latitude and transmittance:
- Area Latitude: It is used to display and set the central latitude of the analysis area, and the value range is -90, 90. Solar Radiation Analysis needs to calculate the solar position and solar altitude according to the central latitude of the analysis area. Because Solar Radiation Analysis is performed at landscape scale and local scale, it is possible to use one latitude value for the entire DEM. For a wider geographical area, it is recommended to divide the study area into different areas by latitude for separate analysis.
If the DGM data is Planar Coordinate System, the user needs to set it according to the location of the analysis area; If the DEM data is Geographic Coordinate System or Projected Coordinate System and the geographical location is correct, the center latitude of the DEM data will be automatically obtained. Setting is not supported. If the latitude range is incorrect, the user needs to enter it manually.
- Transmittance: Transmittance is the ratio of the energy reaching the Earth's surface (averaged over all wavelengths) to the energy received at the upper edge of the atmosphere (outside the atmosphere). Values range from 0 to 1, with 0 being no transmission and 1 being full transmission. Typically, the observed value is 0.6 or 0.7 under conditions of very clear skies and 0.5 under conditions of generally clear skies.
- Elevation Scaling Factor: When the unit of the terrain grid value (i.e. elevation value) is different from the unit of the X and y coordinates, it is usually necessary to multiply the elevation value by an elevation scaling factor to make the three units consistent. For example, the units in the X and Y directions are meters, and the units in the Z direction are feet. Since 1 foot equals 0.3048 meters, you need to specify a scaling factor of 0.3048. If set to 1, there is no scaling. The Projected Coordinate System (in meters) is the
recommended data for analysis. If you choose to run the analysis in a spherical coordinate system, you need to specify an appropriate z-factor for the latitude. If the X, y units are latitude and longitude and the Z unit is the meter, some appropriate Z factors listed in the following table may be used:
Latitude Z-factor 0 0.00000898 10 0.00000912 20 0.00000956 30 0.00001036 40 0.00001171 50 0.00001395 60 0.00001792 70 0.00002619 80 0.00005156
- Area Latitude: It is used to display and set the central latitude of the analysis area, and the value range is -90, 90. Solar Radiation Analysis needs to calculate the solar position and solar altitude according to the central latitude of the analysis area. Because Solar Radiation Analysis is performed at landscape scale and local scale, it is possible to use one latitude value for the entire DEM. For a wider geographical area, it is recommended to divide the study area into different areas by latitude for separate analysis.
- " Result Raster" sets the Result Dataset and Dataset Name to save, and the Datasource to save the Result Data to.
- Datasource: Select the Datasource for Result Data to save.
- Total Radiation: The name of the Raster Dataset used for Show Settings Total Radiation.
- Direct radiation quantity: Check the "Direct radiation quantity" check box to indicate that the result will generate the direct radiation quantity Raster Data of the analysis area. The name of the Direct Radiation Dataset can be set in the text box on the right.
- Scattered radiation quantity: Select the "Scattered radiation quantity" check box to indicate that the result will generate the scattered radiation quantity Raster Data of the analysis area. The name of the scattered radiation quantity Dataset can be set in the text box on the right.
- Direct duration: Check the "Direct duration" check box to indicate that the result will generate the direct duration data of the analysis area in the specified time period. The name of the Direct Duration Dataset can be set in the text box on the right.
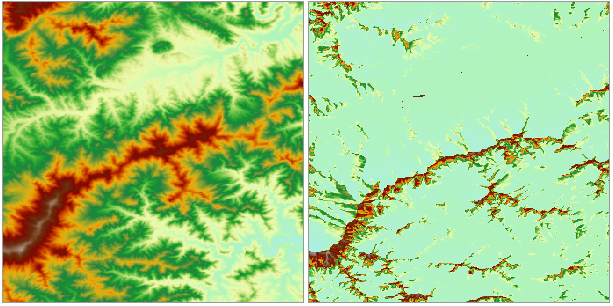
Figure: Solar Radiation Analysis result
 Precautions
- Solar Radiation calculations are time consuming and may take hours or longer to analyze when the amount of DEM data is large.
- When the selected Analysis Type is Day Radiation Analysis, the maximum time range for analysis is one day, that is, 24 hours. Calculation cannot span days, so the start time must be less than end time.
- When the selected Analysis Type is Annual Radiation Analysis, the maximum number of days is the total number of days in a year, and the start date can be greater than end date. For example, if the start date is October 1 and the end date is January 31, the analysis time is from October 1 to January 31 of the next year.