


In the era of big data, the amount and quantity of Data Information are increasing, and its complexity is also increasing. Data display methods are diversified, such as charts, tables, maps, etc., while a single chart or map can only reflect local data. If you want to integrate and associate data display, you need a "data cockpit". Comprehensive layout of multiple data display modes, display complex data to users in the most understandable way, and meet the display needs of industry reports, conferences and exhibitions, business monitoring, risk warning, geographic information analysis and other businesses.
Compared with the traditional static data report, the data visualization method of large map screen is more vivid and intuitive, which can penetrate and mine the hidden information behind the data, transmit the data results quickly and intuitively, and show the dynamic changes of the data in real time. Whether in the fields of retail, logistics, electricity, water conservancy, environmental protection, or transportation, it has increasingly become an indispensable part of Big Data Solution to help business personnel find and diagnose business problems through interactive real-time data visualization screens.
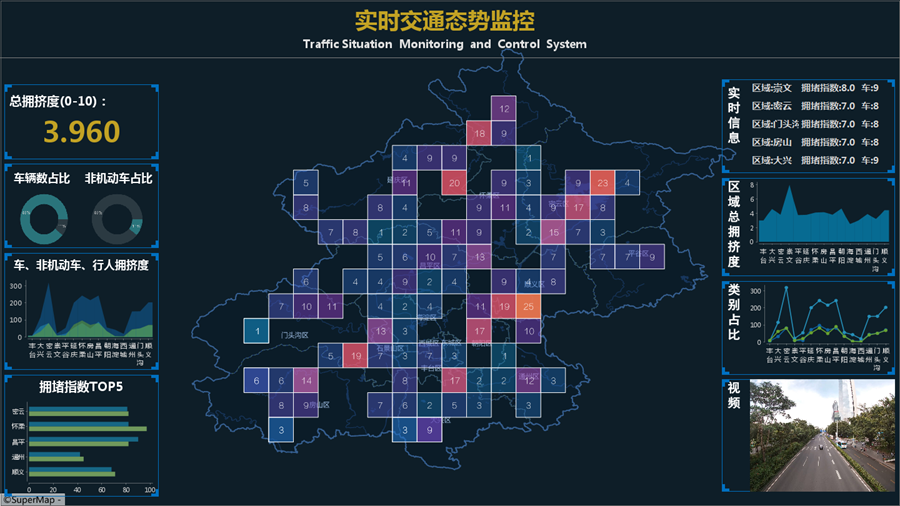
SuperMap iDesktopX map screen can combine map, chart, video, table, text and other elements, support Local Data, database data, stream data, visualize data in a dynamic and static way, and improve the readability of data. At the same time, it can be combined with GIS Geographic Spatial Data for multi-dimensional display, which can better mine the significance and value of data. Users can quickly build a large map screen through simple interface interaction.
Large screen feature
- Diversified data sources
Support access to local data that can be imported (SCV, Excel, GeoJson, Shp and other formats), data in WebDatasource, data in the database, as well as vector Real-time Stream Data and video streams. It meets the user's demand for real-time data detection, and the Data Management mode is simple and convenient.
- Chart Type Rich
Support multiple Diagram types, including column chart, broken line chart, pie chart, area chart, etc., with diversified chart display methods; have data insight, statistics and analysis capabilities, and can output more intuitive Result Data based on the collation and analysis of the original representation data, so that users can make judgments directly.
- Support dynamic map Common thematic map, thermodynamic map, Grid Aggregation Map, Web map, and real-time dynamic map can be added to
the large screen, and users can add different types of maps according to their needs.
- Linkage display of large-screen elements
It supports the linkage display of map and chart to better mine Data Information; it also supports the linkage of map and video, and the video shot by the camera can be played at different camera points of Map Select.
- Large screen with rich elements and multi-dimensional display data
It can display multi-dimensional data through a single page, provide users with relatively multi-dimensional judgment basis, and make up for the drawbacks of traditional data.
- Multi-resolution adaptation and publishing
Provide a variety of conventional resolutions and custom ways to adapt to various screen resolutions, so that the large screen can be perfectly displayed in different screens after release, and can be used in different occasions.
- Graphical interface operation, convenient interaction The construction of large
screen is simple and does not require programming ability. Users can build large screen visualization applications by clicking and dragging. The large screen can be previewed in real time, and what you see is what you get.
Related content
 Large-screen element interaction